Figure 7.

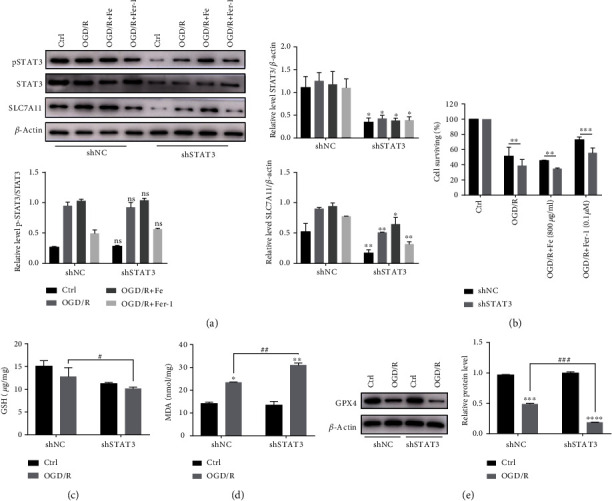
Interference with STAT3 expression may exacerbate OGD/R-induced ferroptosis. Cells transfected with the STAT3 interference lentivirus were subjected to OGD/R. (a) The relative level of STAT3, pSTAT3, and SLC7A11 protein expression after interfering with STAT3. The pSTAT3 intensity was normalized to the corresponding level of STAT3. The STAT3 and SLC7A11 intensity were normalized to the corresponding level of β-actin, and the changes are shown in the histograms. ∗P < .05 and ∗∗P < .01 between the groups. ∗shSTAT3 group compared with that of the shNC group. (b) The cell proliferation activity was measured with a CCK8 assay after OGD/R and treated with Fe or Fer-1. ∗P < .05, ∗∗P < .01, and ∗∗∗P < .001 between the groups. ∗shSTAT3 group compared with that of the shNC group. (c, d) The level of GSH and MDA in STAT3 knockdown cells after the OGD/R model; ∗P < .05, ∗∗P < .01, #P < .05, and ##P < .01 between the groups. ∗OGD/R group compared with the control group; #shSTAT3 group compared with that of the shNC group. (e) Relative level of GPX4 protein expression after interfering with STAT3. ∗P < .05, ∗∗P < .01, ∗∗∗P < .001, #P < .05, ##P < .01, and ###P < .001 between the groups. ∗OGD/R group compared with the control group; #shSTAT3 group compared with that of the shNC group.
