
Figure 3. Itga1−/− HSV-gB/Kb CD8+ T Cells Are Activated, Enter into the Skin, and Clear Replicating HSV.
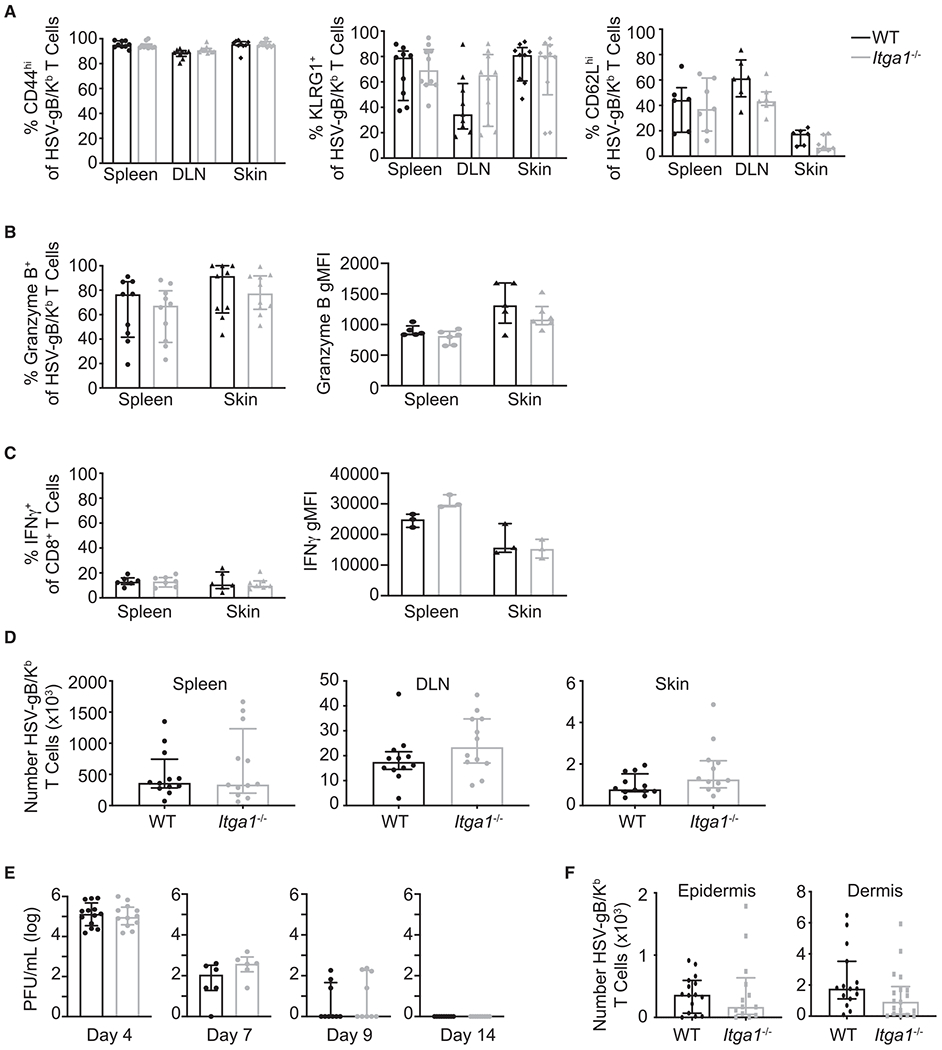
WT and Itga1−/− mice were infected with HSV-KOS.
(A and B) WT and Itga1−/− HSV-gB/Kb CD8+ T cells differentiate comparably following HSV infection. (A) Proportion of HSV-gB/Kb CD8+ T cells expressing CD44, KLRG1, and CD62L in spleen, DLN, and skin 7 days post-infection. Median, IQR. (B) Left panel: frequency of HSV-gB/Kb CD8+ T cells expressing granzyme B+ in spleen and skin 7 days post-infection. Right panel: granzyme B geometric mean fluorescence intensity gated on CD44hi HSV-gB/Kb CD8+ granzyme B+ T cells. Median, IQR.
(C) Left panel: frequency of IFN-γ+ among total CD8+ T cells after in vitro re-stimulation of day 9 skin cells or splenocytes with gB(498–505) peptide. Right panel: IFN-γ geometric mean fluorescence intensity gated on CD44hi HSV-gB/Kb CD8+ IFN-γ+ T cells. Median, IQR.
(D) HSV-gB/Kb CD8+ T cells enter comparably into HSV-infected skin of WT and Itga1−/− mice. Numbers of HSV-gB/Kb T cells recovered from the spleen, DLN, and skin of WT versus Itga1−/− mice 7 days post-infection. Median, IQR.
(E) Both WT and Itga1−/− mice clear replicating HSV. Skin HSV titers 4, 7, 9, and 14 days post-infection. Median, IQR.
(F) HSV-gB/Kb CD8+ T cells migrate into the epidermis of HSV-infected skin of WT and Itga1−/− mice. Numbers of HSV-gB/Kb CD8+ T cells recovered from the epidermis and dermis of WT versus Itga1−/− mice 14 days post-infection. Median, IQR.
Data are compiled from three experiments (A, B left panel, and E) or from two experiments (C left panel, D) or are representative of two experiments (B, C right panel). No significant differences between groups were observed using Mann-Whitney tests.