
Figure 5. Comparison of WT and Itga1−/− Epidermal CD8+ TRM Localization and Morphology.
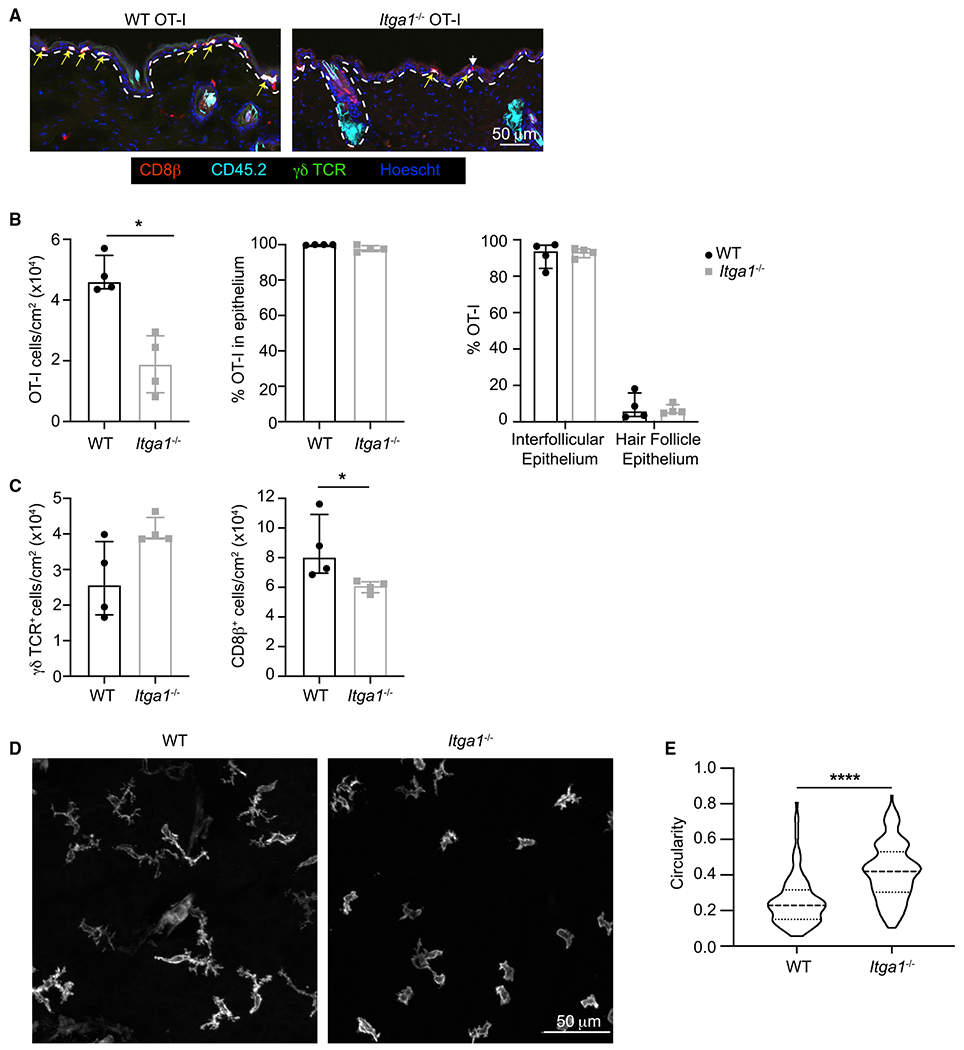
(A) WT CD45.2+ OT-I CD8+ T cells (5 × 10⁴) or Itga1−/− CD45.2+ OT-I CD8+ T cells (5 × 10⁴) were adoptively transferred into CD45.1+ recipient mice. Histological cross-sections of a 1 cm2 area of flank skin surrounding the initial HSV infection sites. Yellow arrows indicate CD45.2+ OT-I T cells; white arrowheads indicate endogenous CD8+ T cells. Dashed lines indicate the dermal-epidermal border. Scale bar represents 50 um.
(B) Densities of WT and Itga1−/− OT-I T cells in the skin (left panel) and comparison of their localization within the epidermis (middle panel) and intrafollicular epithelium versus hair follicle epithelium (right panel). Median, IQR. p = 0.0286, two-tailed Mann-Whitney test.
(C) Densities of γδ T cells (left panel) and CD8b+ T cells (right panel) within the epidermis. Median, IQR. p = 0.03, two-tailed Mann-Whitney test.
(D) Representative images of epidermal CD8b+ T cells in skin of HSV-infected WT or Itga1−/− mice at least 30 days post-infection. Scale bar represents 50 um.
(E) Circularity of epidermal CD8b+ T cells in skin of HSV-infected WT or Itga1−/− mice at least 30 days post-infection. p < 0.0001, two-tailed Mann-Whitney test. Median, IQR.
Data are compiled from two experiments, with a total of six WT and six Itga1−/− mice.