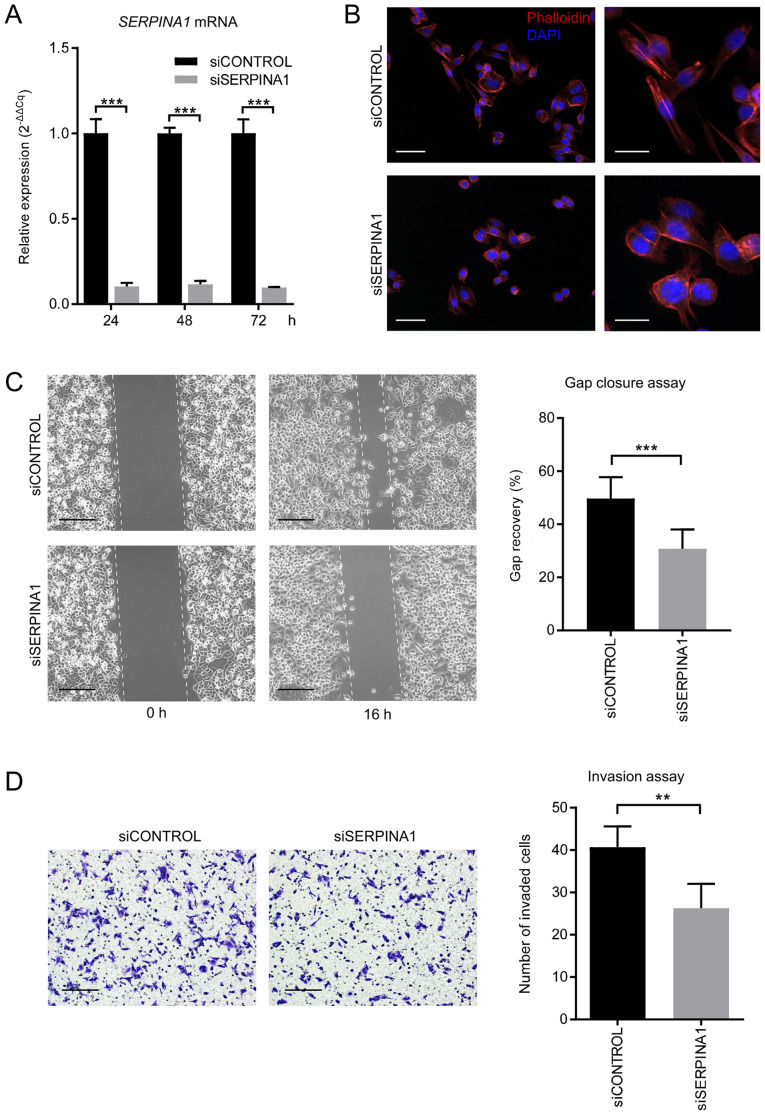
Figure 4.
Effect of siRNA interference on expression of SERPINA1 in AGS gastric cancer cells. (A) mRNA expression of SERPINA1 detected using reverse transcription-quantitative PCR at 24, 48 and 72 h after transfection with negative control siRNA (siCONTROL) or SERPINA1 siRNA (siSERPINA1). The relative levels of SERPINA1 mRNA were normalized using β-actin (n=3). (B) The morphology of siRNA-treated AGS cells. Actin fibers (filamentous actin) were visualized using a phalloidin-Alexa Fluor 555 probe (red), and nuclei were detected using DAPI (blue) at 72 h after siRNA transfection. Scale bar, 100 µm (left panels) and 20 µm (right panels). (C) Gap closure assay. The areas of the gaps were measured at 0 and 16 h post gap insert removal and % gap recovery of the initial gap areas were compared (n=8). Scale bar, 200 µm. (D) Invasion assay. The invading cells were stained with 0.2% crystal violet and counted in four random squares. n=4. Scale bar, 200 µm. **P<0.01, ***P<0.001. SERPINA1, serpin peptidase inhibitor clade A member 1; si, small interfering.

