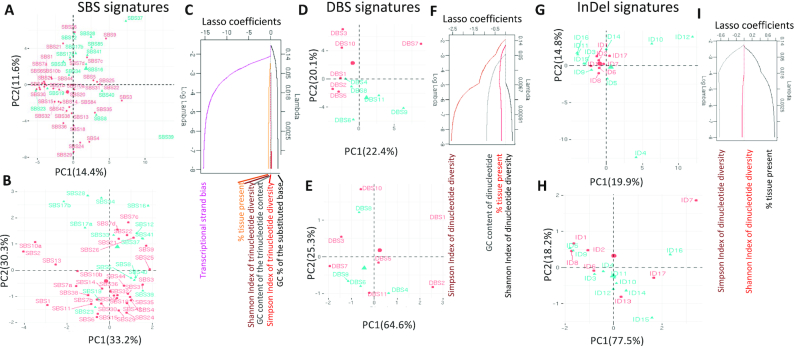
Figure 2.
Differences between known and hitherto unknown SBS, DBS and InDel mutational signatures. PCA plots showing known (pink) and unknown (cyan) SBS signatures based on their (A) trinucleotide frequencies, and (B) multiple features including GC content, Shannon’s and Simpson’s diversity indices of trinucleotide context usage, transcriptional strand bias and presence in proportions of cancer types that could be computed based on their COSMIC signature information alone. (C) Coefficients of the features with decreasing lambda in a LASSO regression are shown. PCA plots showing known (pink) and unknown (cyan) DBS signatures based on their (D) dinucleotide frequencies, and (E) multiple features including GC content, Shannon’s and Simpson’s diversity indices of dinucleotide context usage and presence in proportions of cancer types. (F) Coefficients of the features with decreasing lambda in a LASSO regression are shown. PCA plots showing known (pink) and unknown (cyan) InDel signatures based on their (G) nucleotide frequencies, and (H) multiple features including Shannon’s and Simpson’s indices and presence in proportions of cancer types. (I) Coefficients of the features with decreasing lambda in a LASSO regression are shown. In all cases, random forest mean decrease in Gini index and mean decrease in accuracy, which indicate feature importance, also showed comparable patterns.

