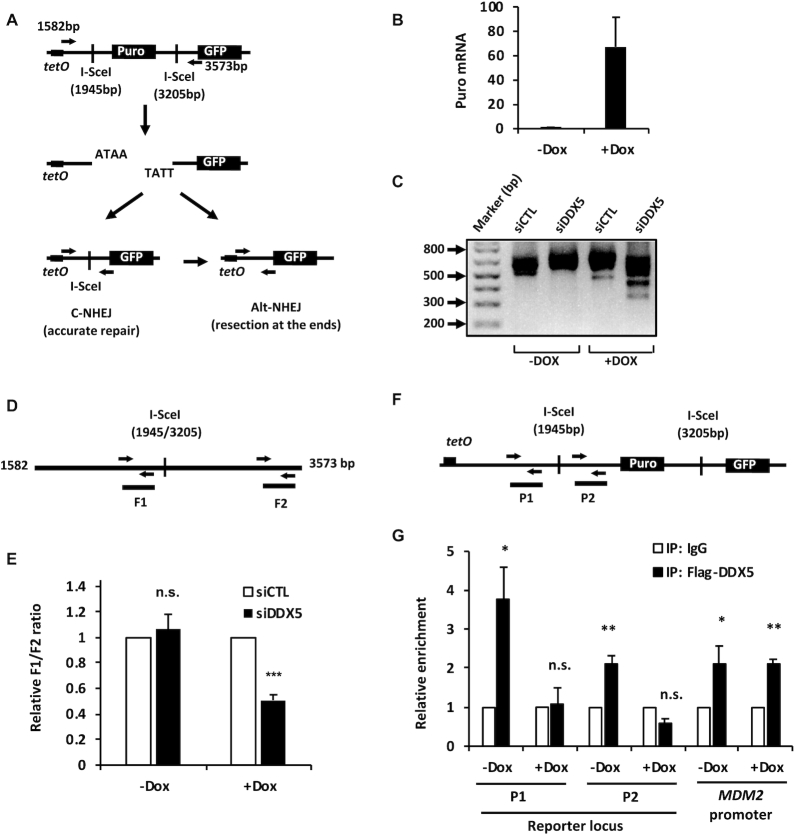
Figure 6.
Increased DNA end deletions in DDX5-deficient cells are associated with local gene transcription. (A) Illustration of a tetracycline-induced (tetO) reporter system for NHEJ repair analysis in HEK293. The reporter construct is similar to the one described in Figure 4A except that the reporter expression is controlled by a tet-on promoter. (B) RT-qPCR analysis of the expression of puromycin in the absence (−Dox) or presence (+Dox) of 1 μg/ml Dox. (C) The HEK293-tetO-puro-GFP reporter cells were transfected with indicated siLuc control siRNA (siCTL) and siDDX5 #3 (siDDX5), respectively, in the absence (−Dox) or presence (+Dox) of 1 μg/ml Dox. Forty to forty-four hours after the siRNA transfection, the cells were then transfected with I-SceI-expressing vector (pCAG-I-SceI). Seventy hours after the plasmid transfection, the cells were harvested and the genomic DNA was extracted for PCR analysis using the primers shown in (A). The PCR primers amplify a DNA fragment with a size of 733 bp if the two ends are accurately repaired. Under the PCR reaction condition, the DNA (3573–1581 equals 1992 bp) without cleavage cannot be amplified. A representative agarose gel was shown for the analysis of the PCR products. (D) The PCR products amplified with the primers as in (A) were subjected to qPCR analysis targeting different regions surrounding the I-SceI sites. The ratio of F1/F2 that was normalized to the one in the siCTL sample. (E) The graph shows the average and SEM from three independent experiments performed in triplicates. (F, G) The HEK293-tetO-puro-GFP reporter cells were co-transfected with Flag-DDX5 and I-SceI-expressing plasmids in the absence (−Dox) or presence (+Dox) of 1 μg/ml Dox. ChIP-qPCR was performed to determine DDX5 occupancy near the I-SceI-cleaved DNA breaks (P1 and P2). MDM2 promoter region was used as a positive control. The results were normalized to IgG control at each condition. The graph shows the average and SEM from four independent experiments. Statistical significance was assessed using Student’s t-test: *P < 0.05; *P < 0.01; ***P < 0.001; n.s., no significant.

