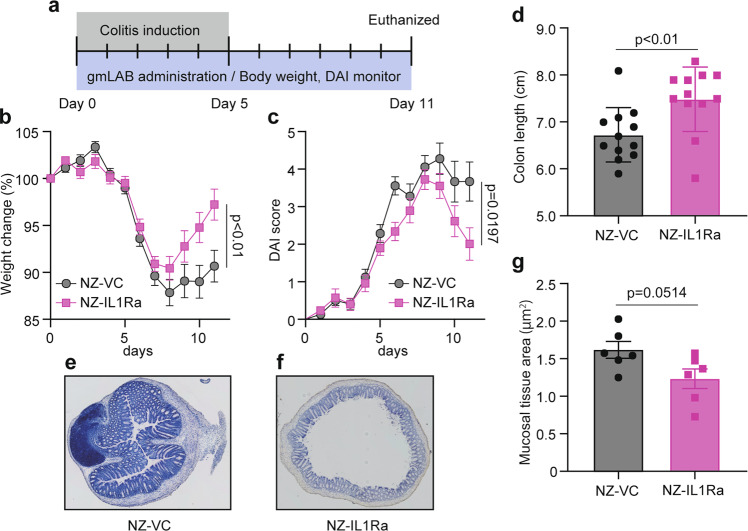
Fig. 5. Effect of oral administration of NZ-IL1Ra on DSS-induced colitis in model mice.
a Schedule for colitis induction and oral administration. The in vivo experiment was repeated 3 times (total n = 18). b, c Change in body weight and DAI score, respectively, of mice with DSS-induced colitis. Data are the mean ± SE (n = 18). The p values of day 11 results are shown. d Colon length on day 11. Data are the mean ± SE (n = 12), and each dot in the plot represents one mouse. e, f Representative images of colon tissue stained with HE (10× magnification). e NZ–VC, f NZ-IL1Ra. g Total mucosal area on day 11. Data are the mean ± SE (n = 6), and each dot in the plot represents one mouse.

