
Figure 4.
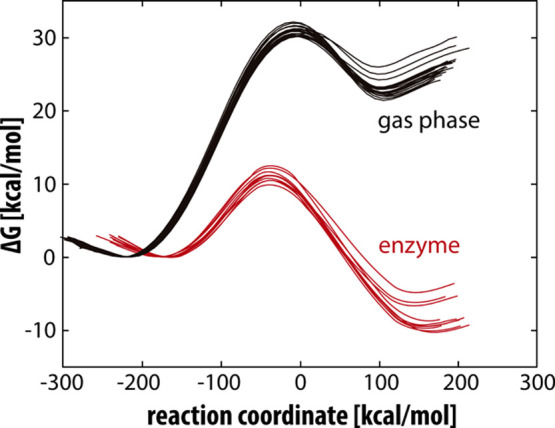
Reaction profiles for the decomposition of neutral serotonin. The gas-phase profiles are depicted in black, while the MAO A-catalyzed profiles are in red. The reaction coordinate is defined as the energy difference between EVB states 2 and 1 and is commonly used in displaying EVB free-energy profiles.