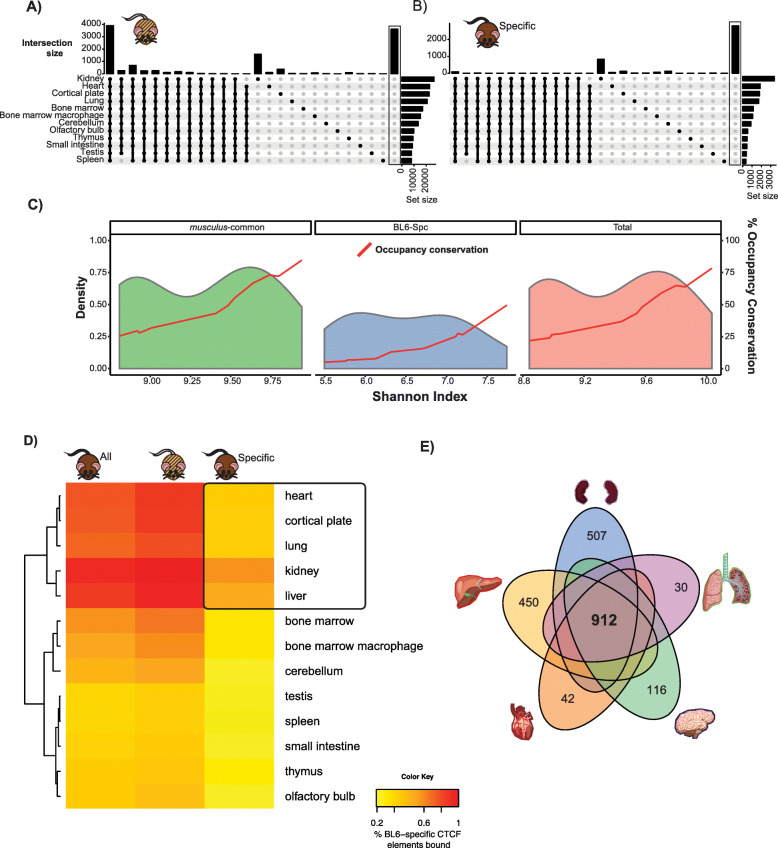
Fig. 3.
Almost 10,000 BL6 subspecies-specific CTCF binding sites are shared among five tissues. a, b UpSet plot of CTCF binding sites we mapped in liver and their binding across 12 adult tissues as identified in the mouse ENCODE project [48] for musculus-common (a) and BL6-specific (b) sites. The number of sites bound at each combination of tissues is indicated on the y-axis on the top bar chart. The rightmost bar on each UpSet plot (boxed) indicates the number of CTCF binding sites that were not found to be bound in any other ENCODE tissue library. c Strong association between tissue-wide CTCF binding and occupancy conservation across 12 tissues. The plots show the density of CTCF binding sites across different tissue diversity values. The diversity values indicated on the x-axis were calculated using the Shannon Diversity Index (see the “Methods” section). The red line is for the proportion of conserved CTCF occupancy within each bin of Shannon index, calculated based on the number of CTCF sites bound for each category across tissues separately. d Tissue distribution analysis of CTCF binding sites found to be musculus-common and subspecies-specific using ENCODE CTCF ChIP-seq data across 13 tissues. The heatmap indicates the overlap of musculus-common/BL6-specific CTCF binding which also binds in ENCODE tissues, with the five most similar tissues for BL6-specific binding highlighted. e Venn diagram highlighting CTCF BL6-specific sites that are shared between all of the five most similar tissues and those found in only one of the tissues

