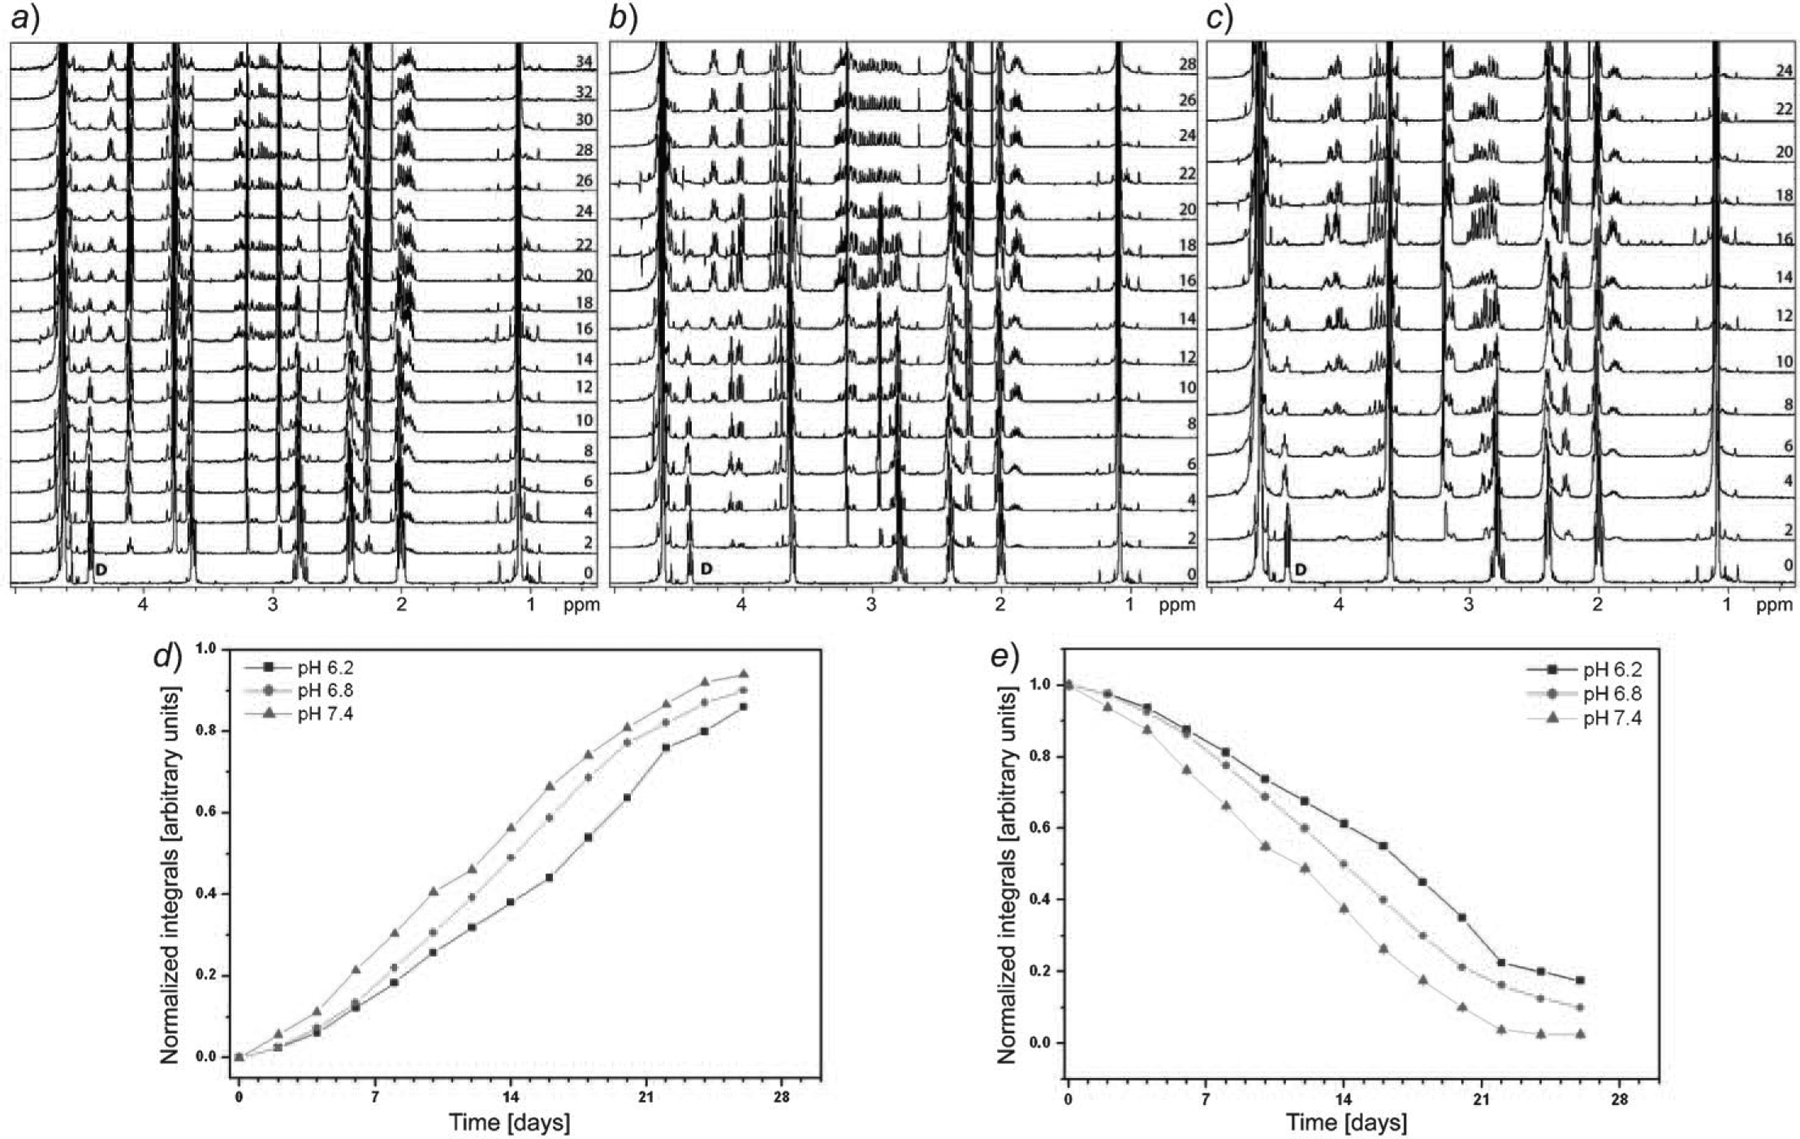
Fig. 2. Section of 1D 1H-NMR spectra of GSH degradation studies recorded at pH 6.2 (a), 6.8 (b), and 7.4 (c).

Drop in the intensity of the peak arising from protons D (annotated in 0 day spectrum) indicate cleavage of Glu-Cys bond in GSH which follows proposed degradation pathway. Numbers in panel a, b, and c denote days on which the spectra has been recorded during the studies. d) Half-life for the cleavage of the amide bond in GSH at three pH values: 7.4 (12 d), 6.8 (14 d), and 6.2 (17 d). NMR Integrals are derived for 1H peak arising from D. e) The increase in the concentration of the ‘β-pyroglutamic acid proton’ (at 1.89 ppm) during the course of study which is the first cleavage products. The error in the integral is generated from integrating the noise at a fixed ppm (9.9–10.0 ppm).
