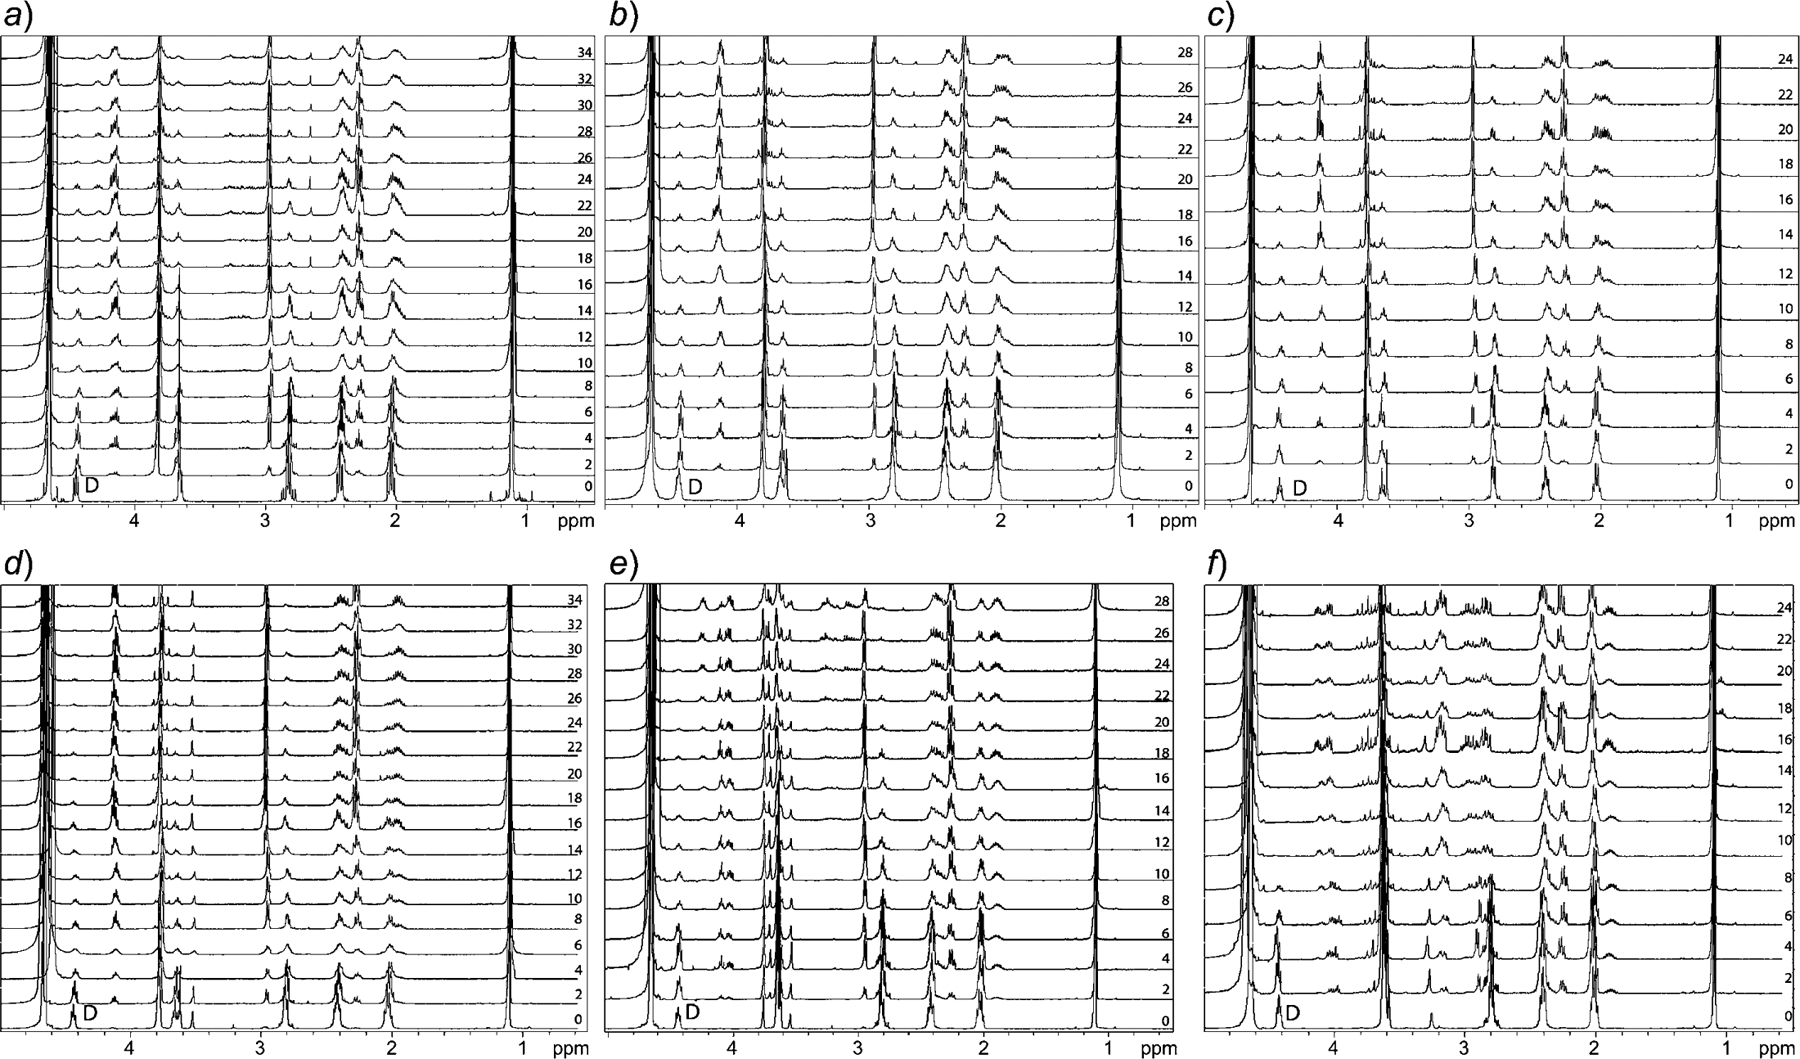
Fig. 4. Section of 1H-NMR of the GSH degradation studies performed in the absence of O2.


In 100 mm sodium phosphate buffer at pH 6.2 (a), 6.8 (b), 7.4 (c); with 1 mm EDTA in 100 mm sodium phosphate buffer at pH 6.2 (d), 6.8 (e), 7.4 (f); and with 20 mm sodium phosphate buffer at pH 6.2 (h), 6.8 (i), 7.4 (j). Several degradation products are now missing (e.g., peaks in the region of 2.8 to 3.2 ppm) in spectra recorded from a to c. Drop in the intensity of the peak arising from H-atoms D (annotated in 0 day spectrum in all panels) indicates cleavage of Glu-Cys bond in GSH, which follows proposed degradation pathway. Numbers in panels denote days on which the spectra have been recorded during the studies.
