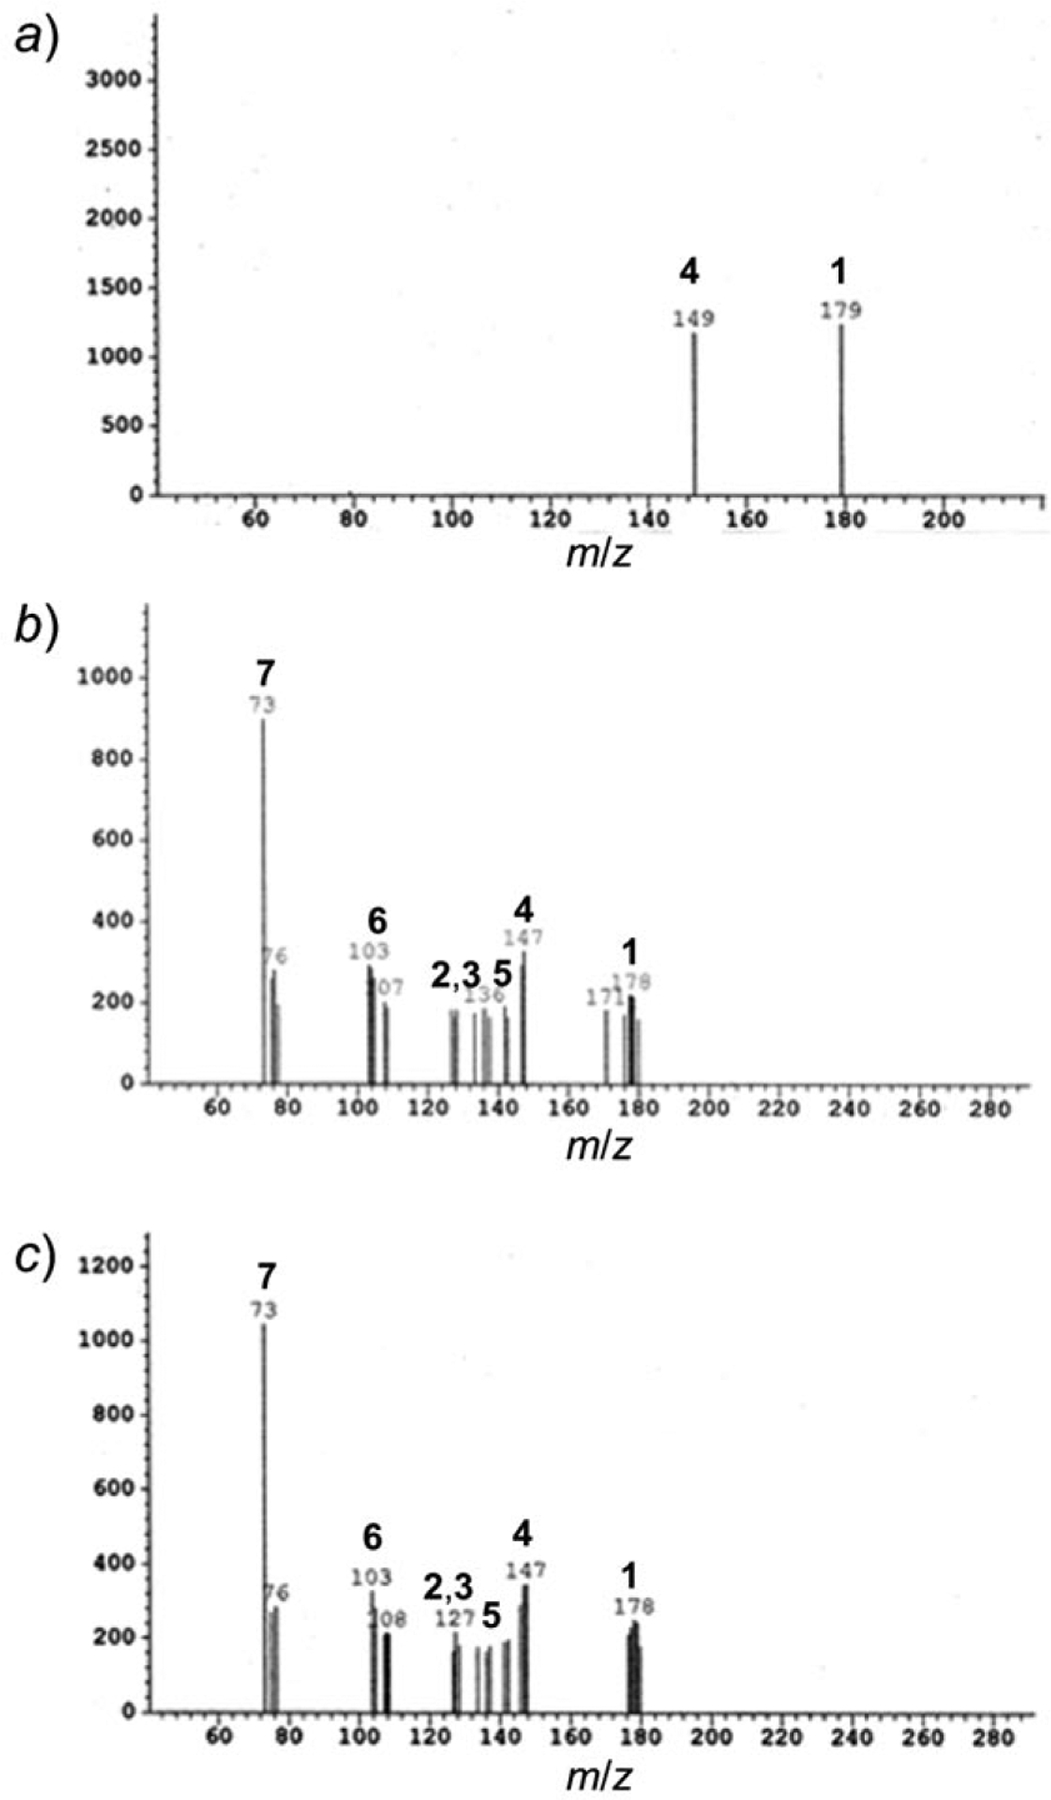
Fig. 5. Mass spectra of the crude reaction mixtures.

Degradation studies were carried out at pH 7.4, a) in the absence of oxygen, b) in 100 mm sodium phosphate buffer containing 1 mm EDTA, and c) 20 mm sodium phosphate buffer. Similar results were obtained for other two pH values. Signals are marked corresponding to peaks for cysteinyl-glycine (1), pyroglutamic acid (2) and 5-oxoproline (3), glutamic acid (4), cysteinesulfenic acid (5), 2-amino-3-oxopropanoic acid (6), and glycine (7).
