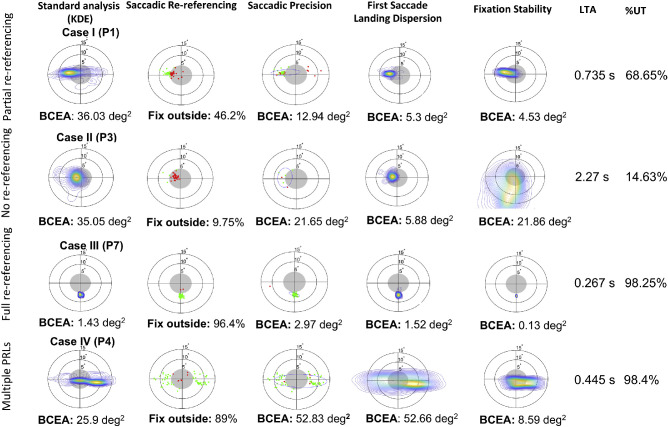
Figure 4.
Oculomotor metric analysis for four example participants showing different eye movement behaviors. The first column shows the standard representation of oculomotor behavior as a probability density map estimated on the fixation distribution (Crossland et al., 2004). The second column plots, for each trial, the location of the first fixation. Saccadic re-referencing is the percentage of trials in which this first fixation placed the target in a visible position (outside the scotoma). The third column plots, for each trial, the first fixation that does not cover the target. Saccadic precision is a measure of the dispersion of these locations. The fourth column plots the probability density of the first ‘absolute’ fixation of the trial, whether or not the target was visible. The first saccade landing dispersion is a measure of the dispersion of these fixation locations. The fifth column shows the distribution of all eye positions after the first saccade in each trial. The center of the image represents the location of the first saccade. Fixation stability measures the dispersion of these eye positions. The sixth column shows the latency of target acquisition, the time from target appearance until the target is in a visible position on the retina. The seventh column shows the percentage of trials that were useful (% UT), indicating the proportion of trials per session in which at least one fixation placed the target outside the scotoma.

