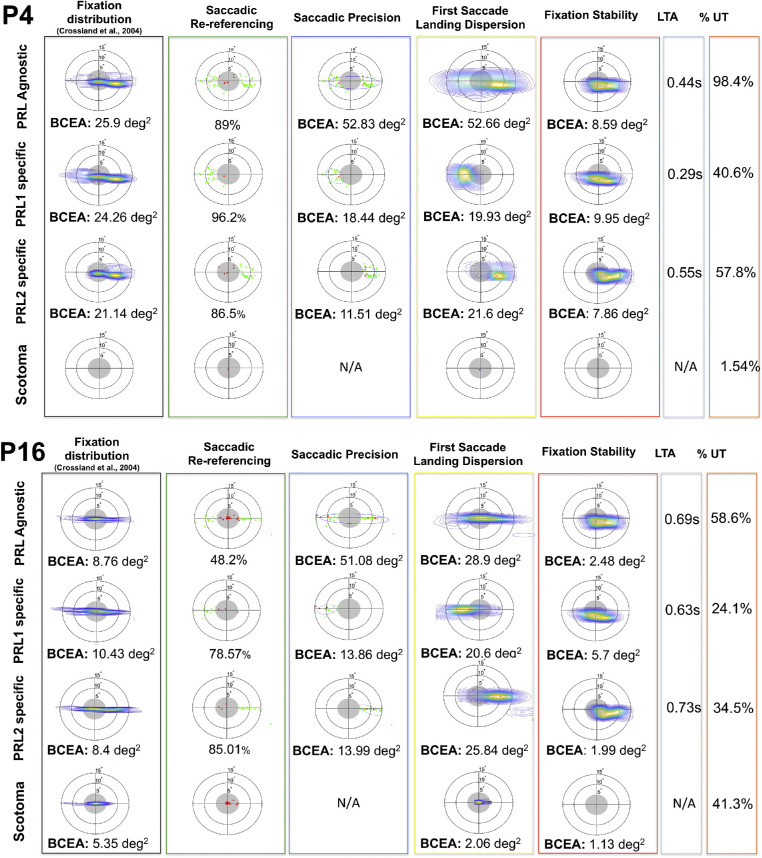
Figure 5.
PRL-specific analysis for two participants (participant 4 and participant 16) exhibiting multiple PRLs. In each figure, the first row shows the metrics computed for the whole dataset, whereas the remaining rows show the analyses conducted on trials specific to a given PRL. The first column presents the data in the standard representation, whereas the remaining columns show the proposed metrics, following the template of Figure 3.

