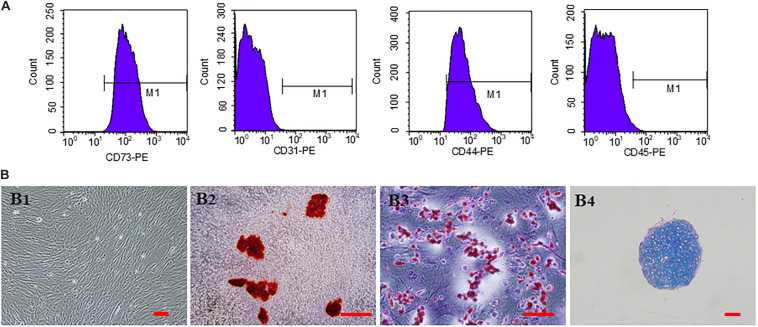
FIGURE 2.
Characterization and in vitro multipotent differentiation of hucMSCs. (A) Flow cytometric analysis of surface markers presented by hucMSCs. (B) Representative images of third generation hucMSCs (B1). Representative images of osteogenesis (B2), adipogenesis (B3), and chondrogenesis (B4) of hucMSCs after Allizerin Red, Oil Red O and Alcian blue staining, respectively. Scale bar: 100 μm.

