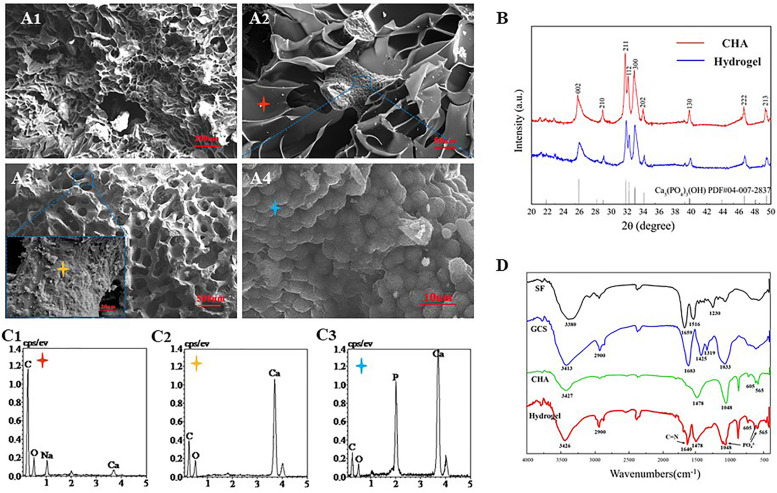
FIGURE 4.
Scanning electron microscopy (SEM) and X-ray diffraction (EDS) analyzes of CHA/SF/GCS/DF-PEG hydrogel. (A1) 200× (Scale bar: 20 μm) and (A2) 500× magnification (Scale bar: 50 μm) of SEM images of CHA/SF/GCS/DF-PEG hydrogel. (A3) Surface morphology of corals (100× and 5.00K× magnification; scale bar: 500 and 20 μm, respectively). (A4) Surface morphology of hydrothermally converted sea coral (5.00K× magnification; scale bar: 10 μm). (B) X-ray diffraction (XRD) pattern of CHA and CHA/SF/GCS/DF-PEG hydrogel. (C1–C3) Red, yellow and blue stars correspond to the EDS analysis results, respectively. (D) Fourier-transform infrared (FTIR) spectra of SF, GCS, CHA and CHA/SF/GCS/DF-PEG hydrogel.

