FIGURE 8.
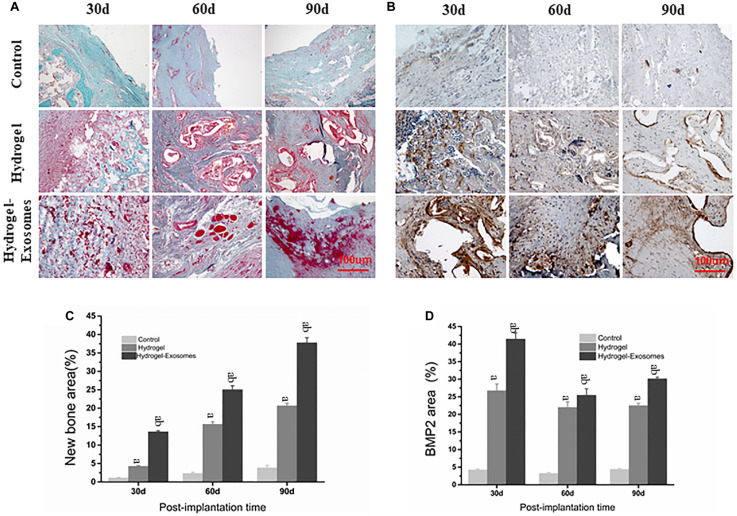
Masson’s trichrome and BMP-2 staining of bone defect sections and quantitative analysis of bone deposition 30, 60 and 90 days post-implantation of CHA/SF/GCS/DF-PEG hydrogel or CHA/SF/GCS/DF-PEG hydrogel associated with hucMSC-derived exosomes. Representative images of Masson’s trichrome staining (A) and BMP-2 staining (B) of the bone defect sections. In Masson’s trichrome staining, the new bone tissue is observed in red and the collagen tissue in blue-green. Quantitative analysis of the percentage of new bone area formed (C) and BMP-2 stained area (D) in the control and in the two experimental groups in the three observed times. a, P < 0.05 compared to the control group; b, P < 0.05 compared to the hydrogel group.

