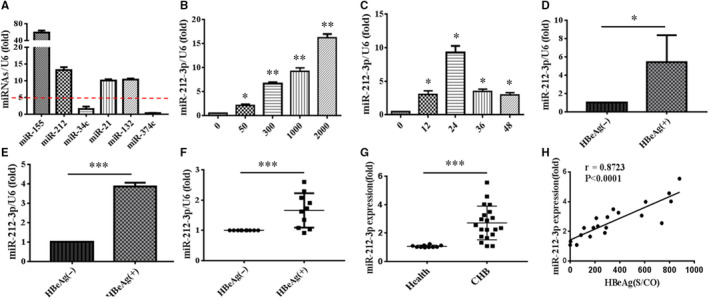
FIGURE 1.

Expression of miR‐212‐3p was augmented in macrophages stimulated by HBeAg. RAW264.7 macrophages were stimulated by HBeAg (2000 ng/mL) for 24 h, and then, the expression of miR‐155, miR‐212‐3p, miR‐34c, miR‐21, miR‐132 and miR‐374c was assessed with q‐PCR (A). RAW264.7 macrophages were stimulated with different doses of HBeAg (0, 50, 300, 1000, 2000 ng/mL) for 24 h; the expression of miR‐212‐3p was tested by q‐PCR (B). RAW264.7 macrophages were treated with HBeAg (1000 ng/mL) for different time as shown; the expression of miR‐212‐3p was analysed by q‐PCR (C). THP‐1 cells were stimulated with HBeAg (2000 ng/mL) for 24 h; the level of miR‐212‐3p was detected by q‐PCR (D). U937 cells were stimulated with HBeAg (2000 ng/mL) for 24 h; the level of miR‐212‐3p was examined by q‐PCR (E). Peripheral blood monocytes from 10 normal subjects were treated with HBeAg (2000 ng/mL) for 24 h, respectively; the level of miR‐212‐3p was detected by q‐PCR (F). The peripheral blood monocytes of 20 patients with CHB were isolated, and the expression of miR‐212‐3p was detected by q‐PCR (G). The correlation between miR‐212‐3p expression and the content of HBeAg in 20 patients with CHB was analysed (H). Data shown above are representative of at least three independent experiments (mean ± SD of triplicates in A‐G). *P < 0.05, **P < 0.01, ***P < 0.001
