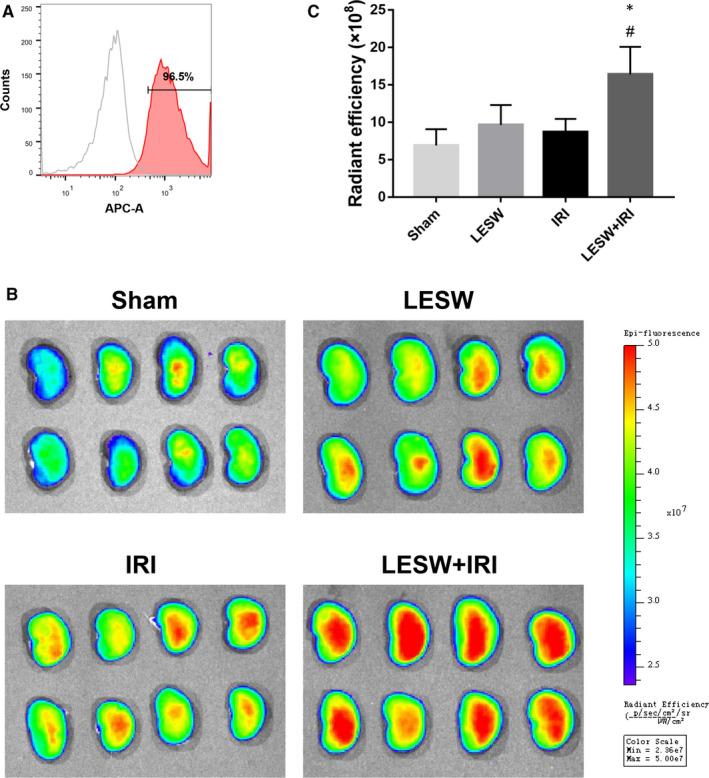
Figure 4.

The distribution of Dil‐C18(5)‐DS labelled circulating endothelial progenitor cells (EPCs). A, Representative flow cytometry histograms of Dil‐C18(5)‐DS label ratio. B, Representative fluorescence images of kidneys detected by in vivo imaging system. C, Quantitative analysis of the retention of the Dil‐C18(5)‐DS labelled circulating EPCs in kidneys at 24 h after reperfusion in the four groups. *P < .05 (LESW + IRI vs Sham); # P < .05 (LESW + IRI vs IRI). LESW, low‐energy shock wave
