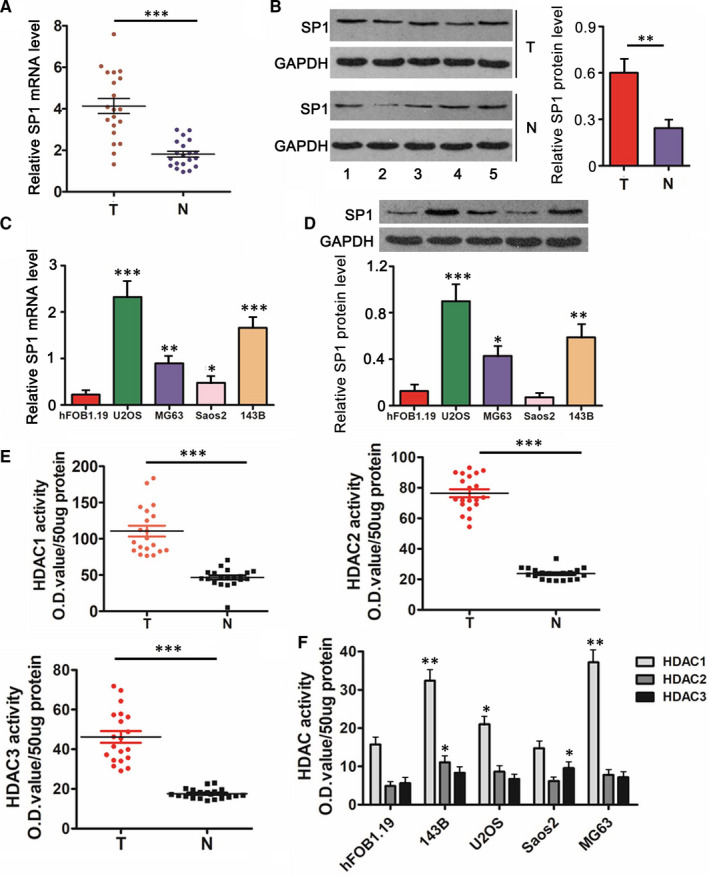
Figure 1.

Up‐regulated SP1 and increased activities of HDACs in OS tissues and cells. SP1 expression was measured in 20 pairs of OS tissues and the matched adjacent normal tissues using RT‐qPCR (A) and western blot assays (B). Figure B shows five representive blots. SP1 expression was measured in OS cell lines and a normal osteoblastic cell line using RT‐qPCR (C) and western blot assays (D). U6 and GAPDH were employed as miRNA and mRNA internal control, respectively. miR‐326 expression was normalized to U6 expression. Activities of HDAC1/2/3 was measured in 20 pairs of OS tissues and the matched adjacent normal tissues (E) as well as in OS cell lines and a normal osteoblastic cell line (F). T means tumour tissues, N means matched adjacent normal tissues. A, B and E: **P < .01, ***P < .001 vs normal tissues. C, D and F: *P < .05, **P < .01, ***P < .001 vs hFOB1.19 cells
