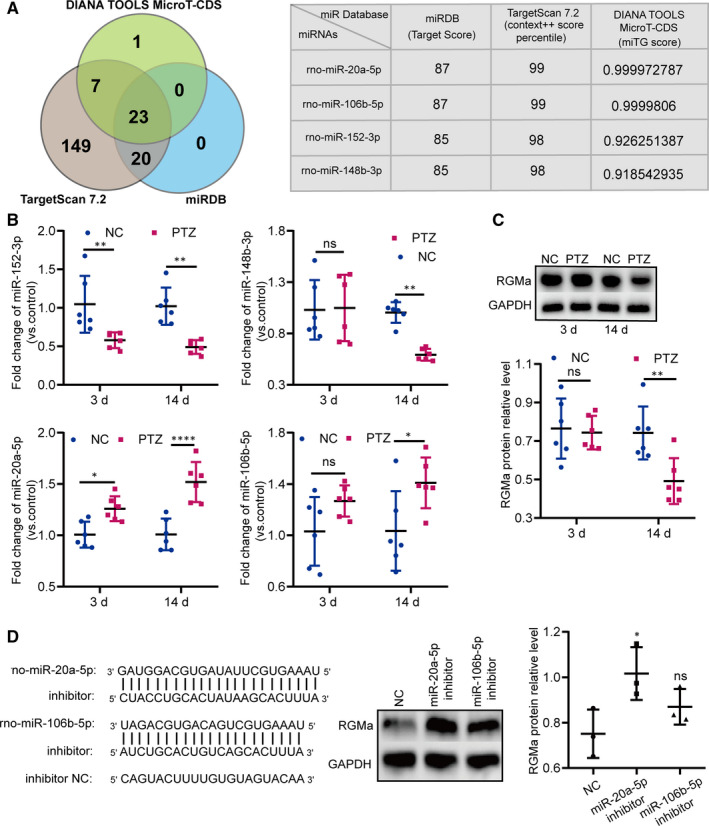
FIGURE 1.

Identifying miR‐20a‐5p as an upstream regulator of RGMa in a PTZ‐induced epilepsy model. A, In silico prediction of 3'UTR‐RGMa binding sites. The Venn diagram shows the number of miRNAs predicted by different algorithms. Twenty‐three candidates were identified by all three tools (DIANA TOOLS MicroT‐CDS, TargetScan 7.2 and miRDB). Among these twenty‐three candidates, the table depicts the scores of four (miR‐106b‐5p, miR‐148b‐3p, miR‐152‐3p and miR‐20a‐5p), all with relatively high scores in all three databases. B, RT‐qPCR results revealing the differences in the expression levels of the four miRNAs (miR‐106b‐5p, miR‐148b‐3p, miR‐152‐3p and miR‐20a‐5p) in PTZ‐induced epilepsy rats at 3 and 14 d (n = 6; two‐way ANOVA, Sidak test). C, Western blot results revealing RGMa protein expression in PTZ‐induced epilepsy rats at 3 and 14 d (n = 6; two‐way ANOVA, Sidak test). D, Based on the observation that miRNAs often negatively regulate the target gene combined with the results in B and C, we designed miR‐20a‐5p and miR‐106b‐5p inhibitors to suppress their expression in PC12 cells. Western blot results revealed that, compared with NC, miR‐20a‐5p inhibitors distinctly reduced RGMa protein expression in PC12 cells. Furthermore, miR‐20a‐5p inhibitors more powerfully regulated RGMa protein expression than miR‐106b‐5p inhibitors (n = 3 independent cell culture preparations; one‐way ANOVA, Dunnett test) (ns P ≥ 0.05, *P < 0.05, **P < 0.01, ****P < 0.0001). All data represent the mean ± standard deviation (SD)
