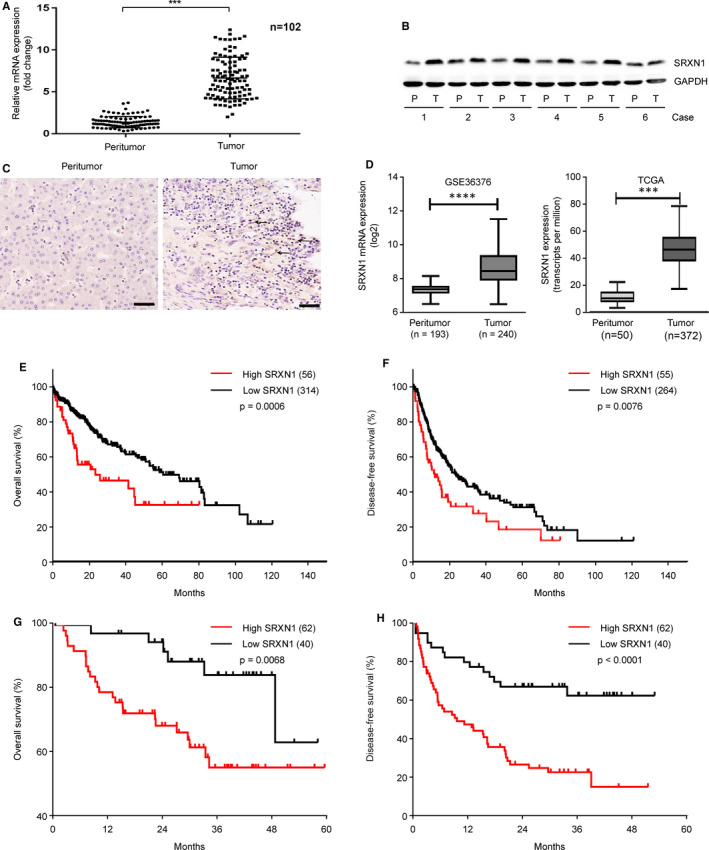
FIGURE 1.

SRXN1 expression is up‐regulated in HCC tumour tissues and is associated with poor survival. A, qPCR analysis of SRXN1 mRNA expression in 102 pairs of HCC and adjacent control tissues. *** indicates P < 0.001. B, Western blot analysis of SRXN1 protein expression in 6 representative pairs of HCC tissue samples. P indicates peritumor tissue; T indicates tumour tissue. C, Representative IHC images (20 × magnification) are shown. The black arrows pointing to the brown puncta indicate positive staining for SRXN1 in the tumour sections. Scale bar: 50 μm. D, mRNA expression of SRXN1 reported in public databases. GSE36376 (left panel) and TCGA (right panel) datasets. *** indicates P < 0.001. E‐F, Analysis of overall survival and disease‐free survival analyses in HCC patients in the TCGA datasets stratified by SRXN1 mRNA expression. G‐H, Analysis of overall survival and disease‐free survival analyses in HCC patients in our own collected tissues. (n = 102)
