FIGURE 4.

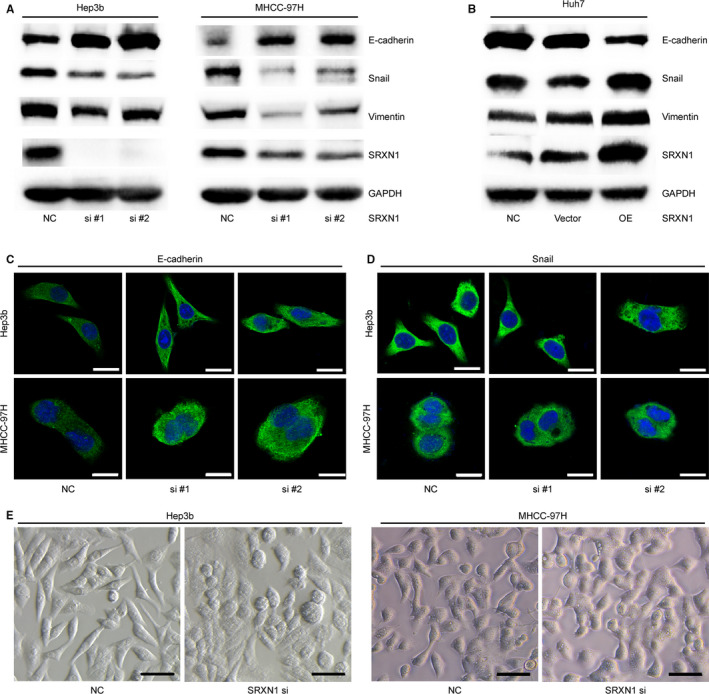
SRXN1 modulated EMT in HCC cells. A, Western blot analysis detecting the expression of EMT‐related molecules after SRXN1 knockdown in Hep3B cells (left panel) and MHCC‐97H cells (right panel). B, Western blot analysis detecting the expression of EMT‐related molecules after SRXN1 overexpression in Huh7 cells. GAPDH was used as an internal control. C, Immunofluorescence results for E‐cadherin expression and localisation in Hep3B and MHCC‐97H cells. Green signal: E‐cadherin; blue signal: nucleus. Cells were observed with a 63X oil lens. Scale bar: 20 μm. D, Immunofluorescence results for Snail expression and localisation in Hep3B and MHCC‐97H cells. The green signal represents Snail, and the blue signal indicates the nucleus. Scale bar: 20 μm. E, Morphology image acquired with a phase‐contrast microscope using a 10X lens. Hep3B (Left) and MHCC‐97H (right) cells were transfected with either a scrambled siRNA or siRNAs targeting SRXN1. Scale bar: 100 μm
