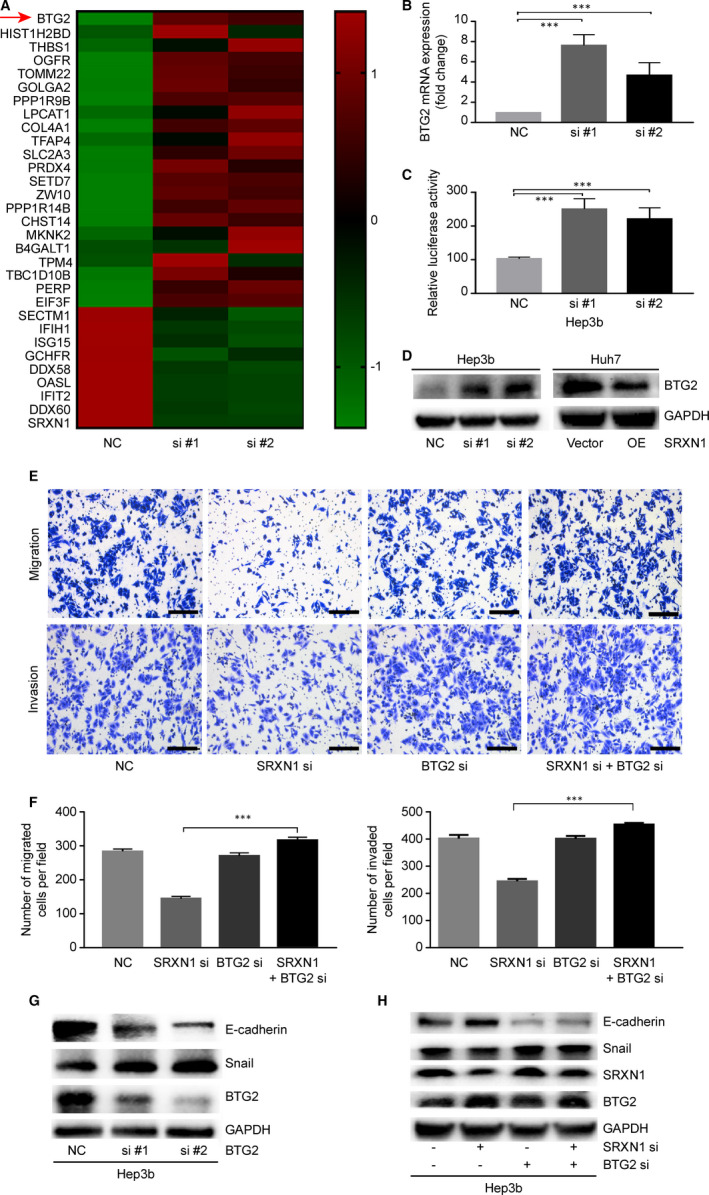
FIGURE 5.

BTG2 is a downstream target of SRXN1. A, Heatmap of differentially expressed genes in control and SRXN1‐knockdown Hep3B cells. The scale bar indicates a log2‐fold change in gene expression. B, mRNA expression of BTG2 determined by qPCR. *** indicates P < 0.001. C, Dual‐luciferase assay detection of BTG2 promoter‐driven luciferase activity in control and SRXN1‐knockdown cells. #1 and #2 indicate two separate siRNAs sequences targeting SRXN1. *** indicates P < 0.001. D, Western blot assays detecting the expression of BTG2 after SRXN1 knockdown. E, Transwell assays of Hep3B cells analysing the migratory and invasive abilities of the cells after SRXN1 and BTG2 silencing. F, Statistical analysis of the migration and invasion of Hep3B cells in the context of SRXN1 and BTG2 silencing. The migrated or invaded cells in five random fields were counted, and the data were subjected to t test analysis. *** indicates P < 0.001. G, Effect of BTG2 knockdown on EMT‐related molecules. si #1 and si #2 represent two separate siRNAs sequences targeting BTG2. GAPDH was used to normalize the protein loading among different samples. H, Western blot assays detecting the expression of E‐cadherin, Snail, BTG2 and SRXN1 in Hep3B cells with SRXN1 silencing alone or in combination with BTG2 silencing
