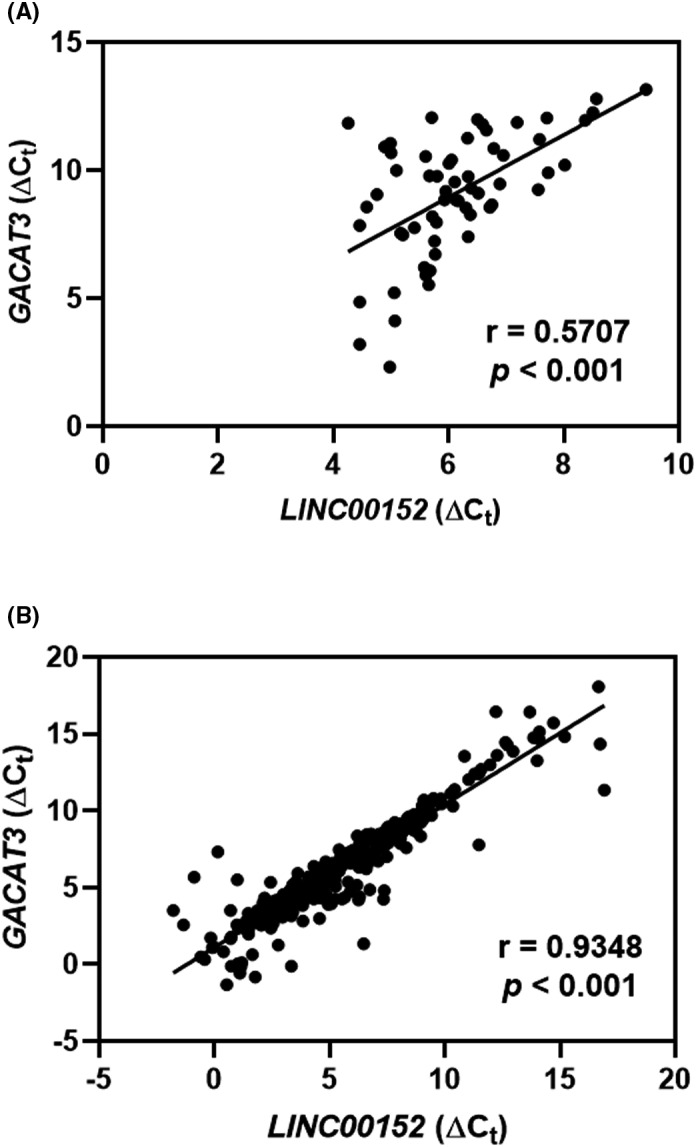
Figure 3.

GACAT3 and LINC00152 are positively correlated in CRC. A, Correlation between GACAT3 expression and LINC00152 expression in cohort 1. B, Correlation between GACAT3 expression and LINC00152 expression in cohort 2. The ∆C t value was calculated by subtracting the β‐actin C t value from the GACAT3 or LINC00152 C t value
