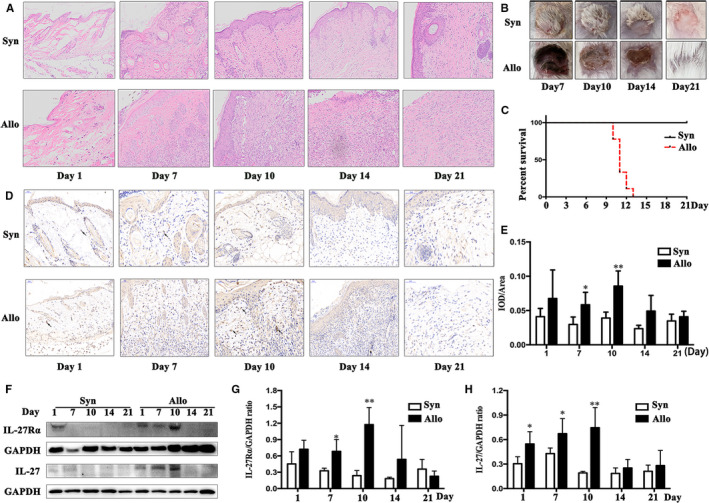
Figure 1.

Expression of IL‐27Rα and IL‐27 in graft post‐transplantation. The graft was isolated on day 1, 7, 10, 14 and 21 post‐transplantation, respectively. The Syn and Allo group indicated syngeneic and allogeneic transplanted mouse, respectively. A, The H&E staining from day 1 to 21 post‐transplantation. B, The appearance of graft post‐transplantation. C, The survival curve of grafts. D, The IL‐27Rα expression in graft determined by immunohistochemical staining (IHC) from day 1 to 21 post‐transplantation. The arrow showed the IL‐27Rα positive cell (brown colour) in graft. E, Quantified IL‐27Rα detected with IHC by IOD/area ratio. F, The IL‐27Rα and IL‐27 p28 expression detected by Western blot. G and H, Quantified IL‐27Rα (G) and IL‐27 (H) expression in Western blot by target molecule/GAPDH ratio. *P < .05, **P < .01, ***P < .001 vs Syn group
