
Figure 2.
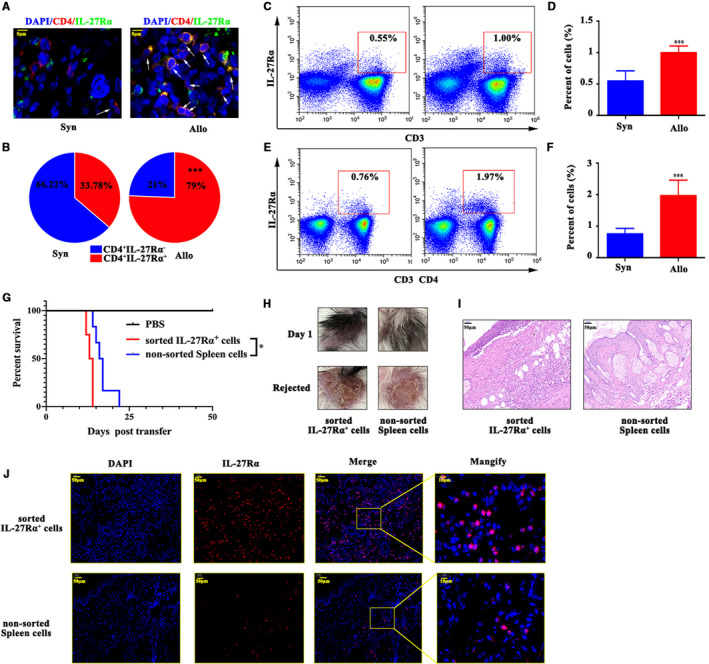
IL‐27Rα induced allograft rejection. Skin transplantation mice models were established and splenocyte and graft was separated on day 10 post‐transplantation. A, The IL‐27Rα (green) and CD4 (red) expression measured by immunofluorescent staining. The cell nucleus was stained with DAPI (blue). The arrow showed the IL‐27Rα+ CD4+cell in skin graft. B, The per cent of IL‐27Rα+ cell in grafted skin CD4+cells. C‐F, Splenic IL‐27Rα+ cells, CD3+T cells (C, D) and splenic CD4+T cells (E, F) detected by flow cytometry. G, The survival assay post‐cells transfer in allografted SCID mouse model. H, The appearance of allograft on day 1 post‐cells transfer and when rejection occurred. I, The H&E staining of the allograft on day 14 post‐cells transfer. J, The IL‐27Rα (green) and CD3 (red)/CD4 (red) expression measured by immunofluorescent staining. The cell nucleus was stained with DAPI (blue). *P < .05, ***P < .001