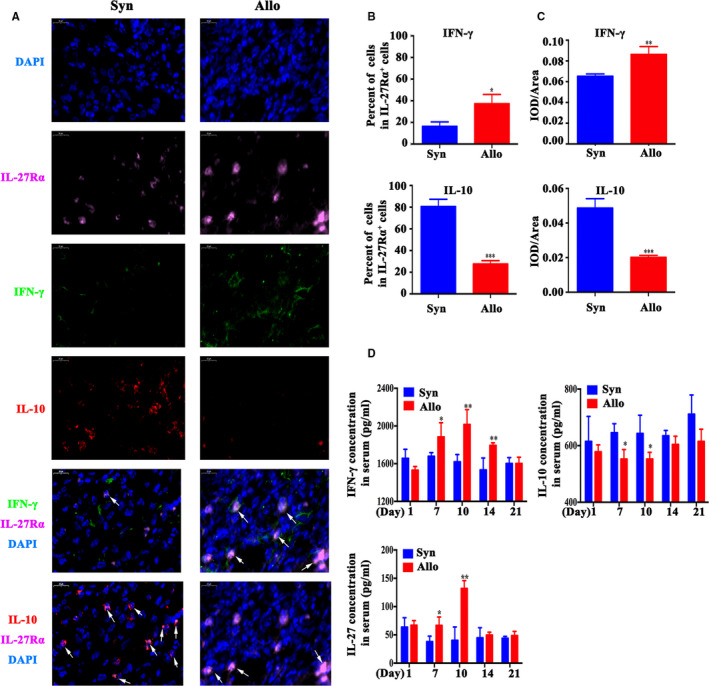
Figure 6.

IFN‐γ, IL‐10 and IL‐27 expression assay. Syngeneic and allogeneic skin mouse model was established and was represented by Syn and Allo group. IFN‐γ, IL‐10 and IL‐27 level were measured in graft and serum. A, The IFN‐γ (green), IL‐10 (red) and IL‐27Rα (pink) expression of graft was measured by immunofluorescent staining on day 10. The cell nucleus was stained with DAPI (blue). Scale bar = 20 μm. The arrow showed the IFN‐γ+/ IL‐10+ and IL‐27 Rα +cells. B, The per cent of IFN‐γ or IL‐10 positive cell in IL‐27Rα positive cells on day 10. C, The IFN‐γ or IL‐10 expression was quantified by IOD/Area value. D, The level of IFN‐γ, IL‐10 and IL‐27 in serum was measured by ELISA from day 1 to day 21 post‐transplantation. *P < .05, **P < .01, ***P < .001 vs Syn group
