
Figure 1.
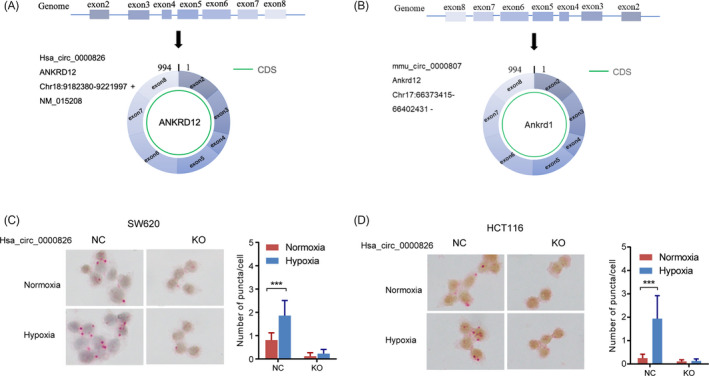
Hypoxia significantly induced expression levels of hsa_circ_0000826 in CRC cells. The circular structure of (A) hsa_circ_0000826 and (B) mmu_circ_0000807. (C) SW620 cells. (D) HCT116 cells. (Two‐way ANOVA, n = 200/group, ***P < .001)
Official websites use .gov
A
.gov website belongs to an official
government organization in the United States.
Secure .gov websites use HTTPS
A lock (
) or https:// means you've safely
connected to the .gov website. Share sensitive
information only on official, secure websites.
Hypoxia significantly induced expression levels of hsa_circ_0000826 in CRC cells. The circular structure of (A) hsa_circ_0000826 and (B) mmu_circ_0000807. (C) SW620 cells. (D) HCT116 cells. (Two‐way ANOVA, n = 200/group, ***P < .001)