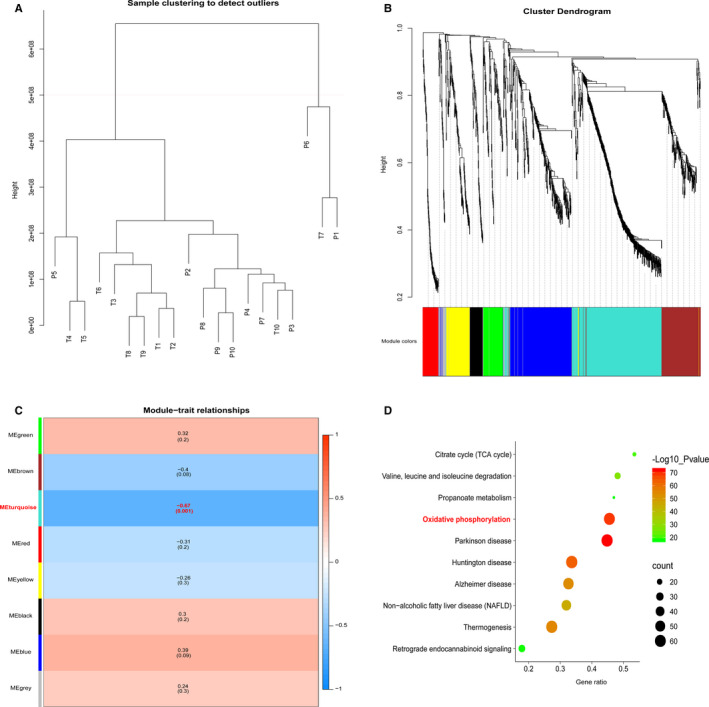
Figure 3.

WGCNA analysis of the GC proteome profiling. A, Samples clustering were conducted to detect outliers between the gastric cancer (T) and adjacent tissues (P). B, Cluster dendrogram was generated by hierarchical clustering to show the modules of highly interconnected groups of genes between T and P groups. C, Heatmap was used to shown the correlation coefficient of module‐traits. D, KEGG pathway analysis of proteins in turquoise
