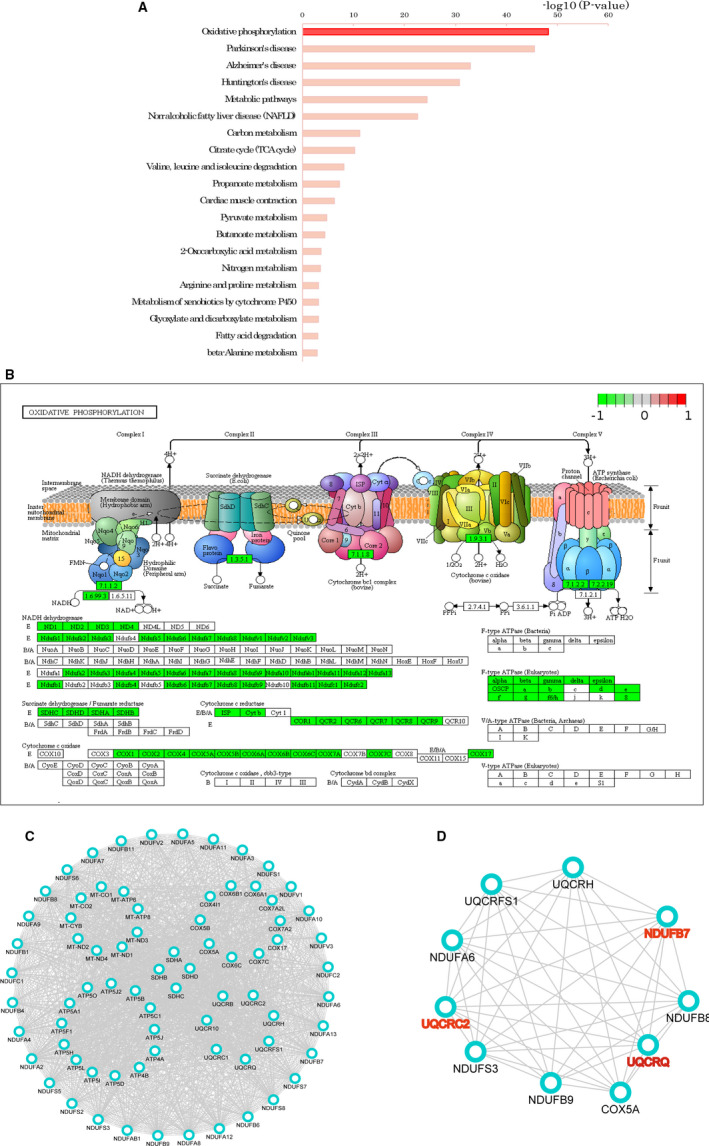
Figure 4.

The pathway analysis of the differentially expressed proteins between the gastric cancer (T) and adjacent tissues (P). A, The significantly enriched top 20 ranking KEGG pathway of the DEPs. B, The oxidative phosphorylation signalling pathway (P‐value = 6.2e−49) played a crucial role in pathogenesis of GC. The green indicates the down‐regulated protein expression in the gastric cancer group. C, PPI network analysis of DEPs involved in oxidative phosphorylation by STRING database. D, The hub network of oxidative phosphorylation
