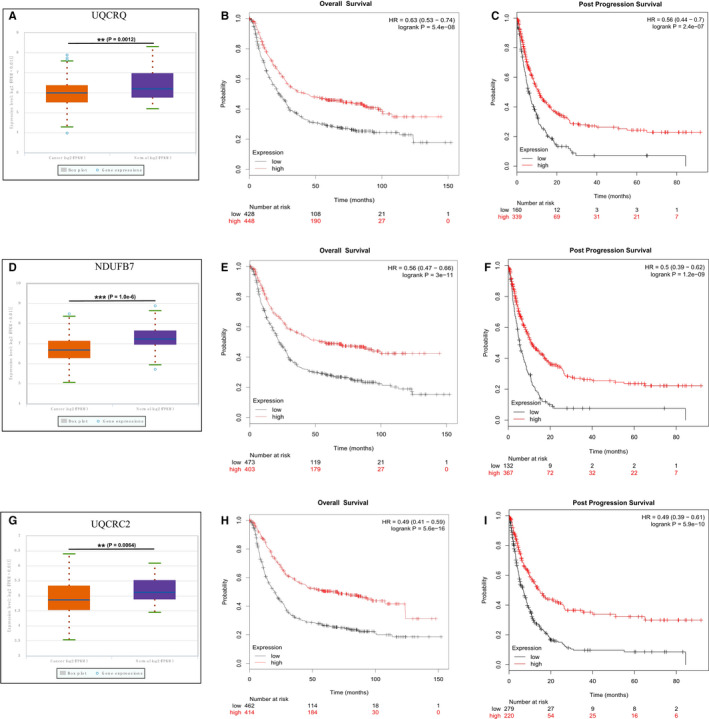
Figure 6.

Gene expression and clinical significance in the TCGA. A, Box plots of UQCRQ mRNA expression (P‐value = .0012). B, C, Overall survival (OS) and Post Progression Survival (PPS) of 876 gastric cancer patients according to the UQCRQ status by Kaplan‐Meier Plotter database. D, Box plots of NDUFB7 mRNA expression (P‐value = 1.0e−6). E, F, Overall survival (OS) and Post Progression Survival (PPS) of 876 gastric cancer patients according to the NDUFB7 status by Kaplan‐Meier Plotter database. G, Box plots of UQCRC2 mRNA expression (P‐value = .0064). H, I, Overall survival (OS) and Post Progression Survival (PPS)of 876 gastric cancer patients according to the UQCRC2 status by Kaplan‐Meier Plotter database
