FIGURE 1.

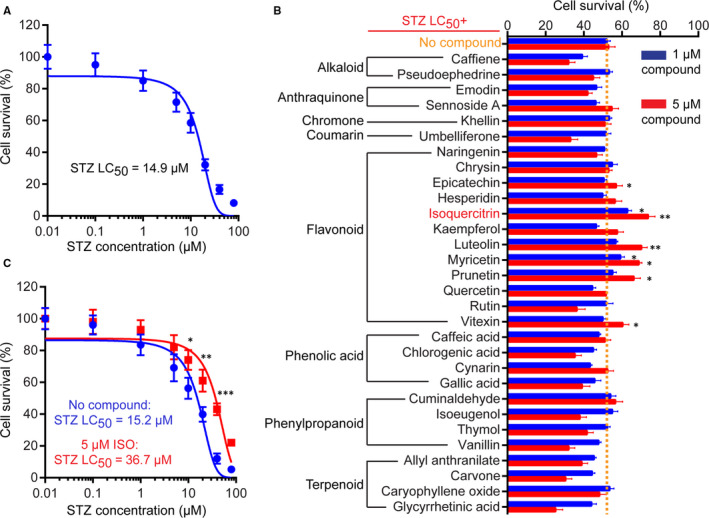
Screening of natural compounds against STZ‐induced cytotoxicity. A, Dose‐response curve of N2a cell viability upon treatment with different concentrations of STZ. The lethal concentration 50 (LC50) of STZ for the N2a cells used in this study is shown. B, Overview of primary screening data. N2a cells were treated with LC50 of STZ alone (no treatment) or in combination with individual natural compounds at two concentrations (1 and 5 μmol/L). Cell viability was analysed by MTT assay and normalized to DMSO‐treated control cells. Data represent mean ± SD of three biological replicates. **P < 0.01; *P < 0.05. C, Dose‐response curve of N2a cell viability upon treatment with different concentrations of STZ alone or in the present of 5 μmol/L ISO. The lethal concentration 50 (LC50) of STZ under the two conditions is shown
