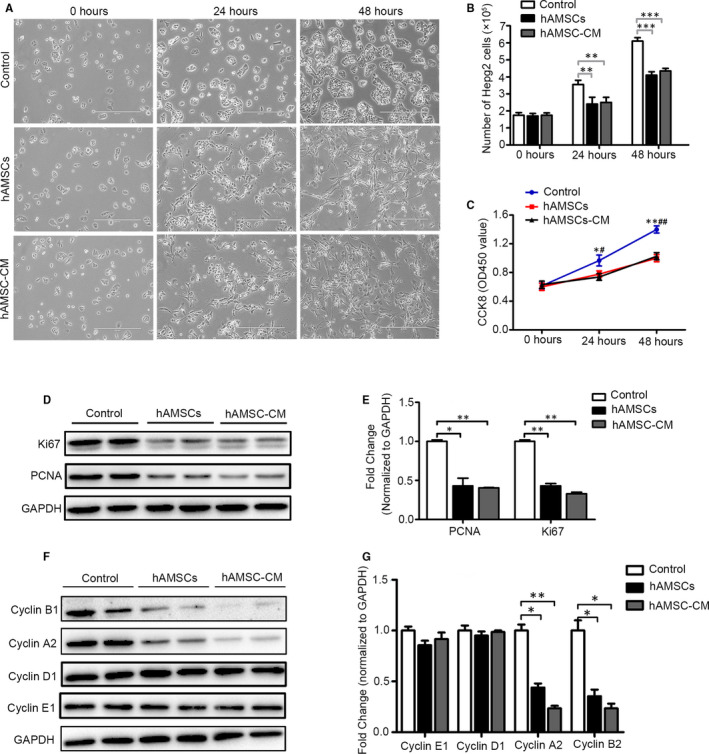
FIGURE 3.

Effect of hAMSCs and hAMSC‐CM on cell proliferation in Hepg2 cells. A, Representative images of Hepg2 cells observed under a light microscope after cultured with normal medium (control), hAMSCs or hAMSC‐CM for 0, 24 and 48 hours. B, Number of Hepg2 cells at 0, 24 and 48 hours post‐treated of normal medium, hAMSCs and hAMSC‐CM were tested by cell counting assay. C, CCK‐8 assay for cell proliferation of Hepg2 cells in the control, hAMSCs and hAMSC‐CM group at different time‐points. D, Western blot analysis of Ki67 and PCNA in Hepg2 cells treated with normal medium, hAMSCs and hAMSC‐CM for 48 h. E, Quantitative analyses of PCNA and Ki67 protein levels in Hepg2 cells as shown in (D). F, Expression of cyclin B1, cyclin A2, cyclin D1, cyclin E1 examined by Western blot in Hepg2 cells in different groups. G, Quantitative analyses for relative protein level of Hepg2 cells as shown in (F). Results are shown as mean ± SD
