
FIGURE 6.
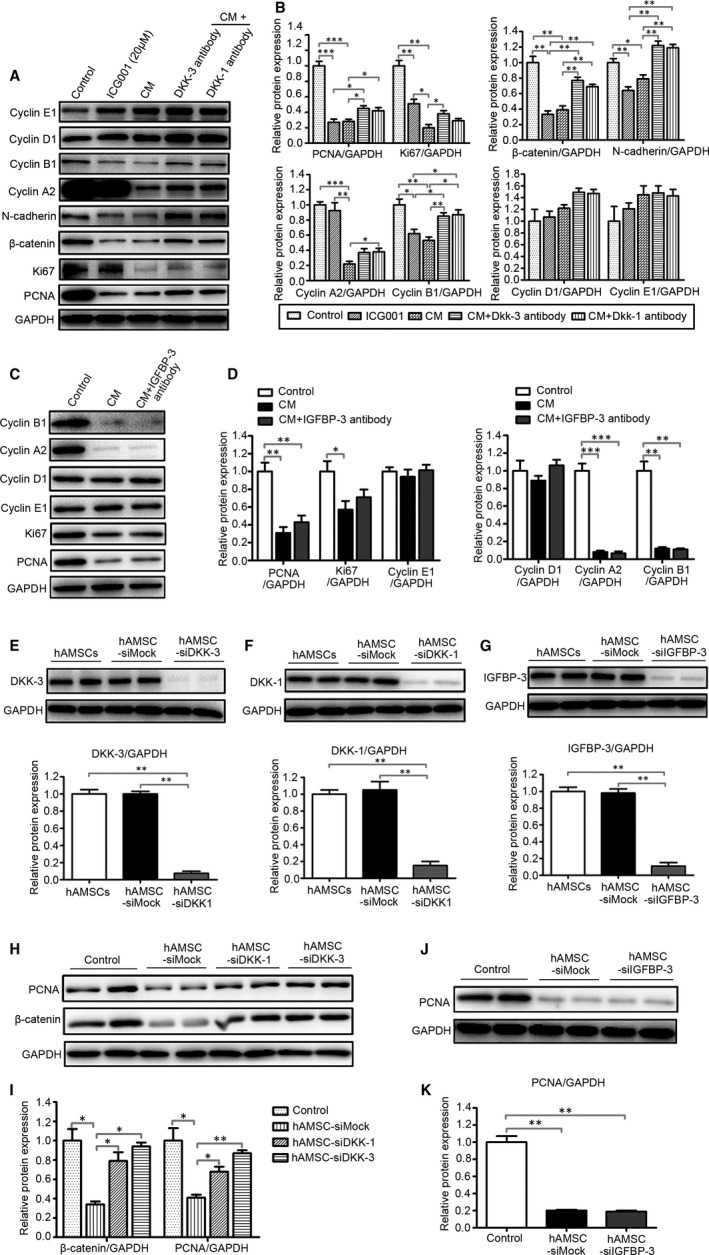
hAMSC‐derived DKK‐3 and DKK‐1 inhibit the proliferation of Hepg2 cells through blocking Wnt/β‐catenin signalling pathway. hAMSC‐CM was pre‐treated with monoclonal antibody against DKK‐1, DKK‐3 and IGFBP‐3 for 24 hours. After which, the Hepg2 cells were treated with normal culture medium, ICG001 (20 μM), CM, CM + DKK‐3 antibody, CM + DKK‐1 antibody and CM + IGFBP‐3 antibody for 48 h. A, The expression of PCNA, Ki67, β‐catenin, N‐cadherin, cyclin A2, cyclin B1, cyclin D1 and cyclin E1 in Hepg2 cells in each group was analysed by Western blot. B, Quantitative analysis of the expression of PCNA, Ki67, β‐catenin, N‐cadherin, cyclin A2, cyclin B1, cyclin D1 and cyclin E1 in Hepg2 cells of different groups as in (A). C, The expression of PCNA, KI67, cyclin A2, cyclin B1, cyclin D1 and cyclin E1 in Hepg2 cells in control (normal medium), CM, CM + IGFBP‐3 antibody group were analysed by Western blot. D, Quantitative analysis of the expression of PCNA, KI67, cyclin A2, cyclin B1, cyclin D1 and cyclin E1 in Hepg2 cells of different groups as in C. The RNAi efficiency of DKK‐3 (E), DKK‐1 (F) and IGFBP‐3 (G) in hAMSCs was assayed by Western blot before co‐culture with Hepg2 cells. H, Western blot analysis showed that the accumulation of β‐catenin and the expression of PCNA were increased in hAMSC‐siDKK3 group and hAMSC‐siDKK1 group when compared with hAMSC‐siMOCK group. I, Quantitative analysis of the expression of PCNA and β‐catenin in Hepg2 cells of different groups as in (H). J, Western blot analysis showed that the expression of PCNA was no significant difference observed in Hepg2 cells co‐cultured with hAMSC‐siMOCK and hAMSC‐siIGFBP‐3. K, Quantitative analysis of the expression of PCNA in Hepg2 cells of different groups as in J. Results are shown as mean ± SD