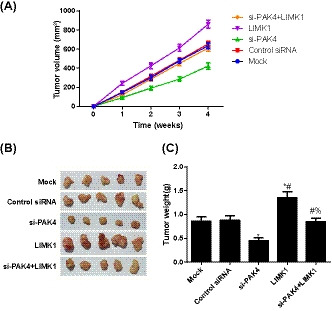
FIGURE 5.

Comparison of subcutaneous tumor of nude mice in each group. A, Growth curve of nude mice in each group; B, Representative images of the tumor morphology in nude mice; C, Comparison of the weight of transplanted tumor of nude mice in each group, *, Compared with Mock group, P < .05; #, Compared with si‐PAK4 group, P < .05; %, Compared with LIMK1 group, P < .05
