Figure 2.

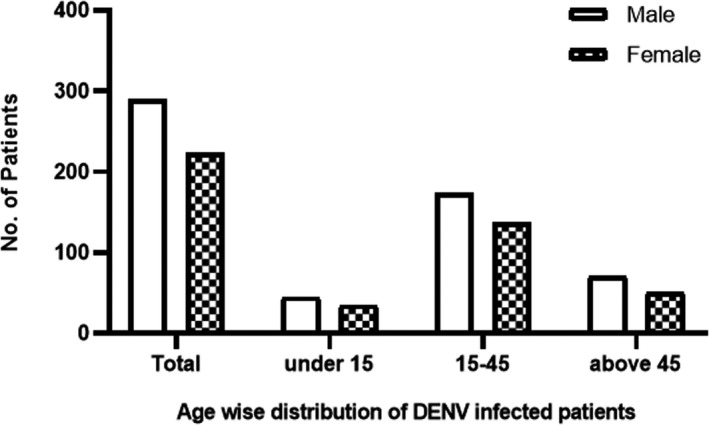
Age‐wise distribution of DENV‐infected patients. Empty bars represent the number of male patients belonging to different age groups, while bars with patterns show the female patients in three age groups

Age‐wise distribution of DENV‐infected patients. Empty bars represent the number of male patients belonging to different age groups, while bars with patterns show the female patients in three age groups