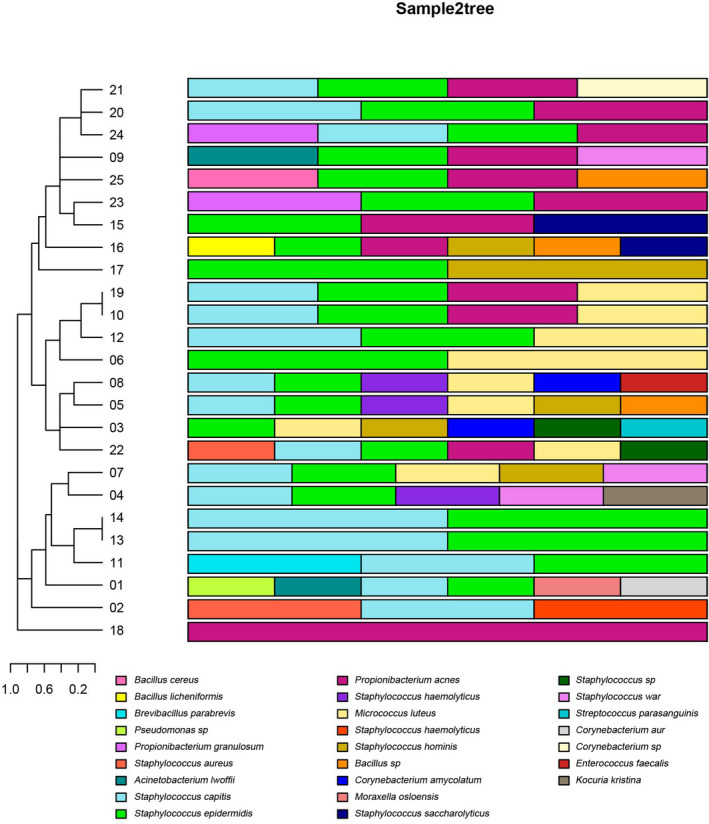
FIGURE 2.

Relative abundance of the most predominant microorganisms in the control areas in 25 patients. Each color piece represents a species, and each color represents a sample of species abundance. Clustering is based on the similarity of species abundance, and different combinations between samples are made according to the strains of mesh, clustering, species and genera, to reflect the multiple samples of colony at the species level
