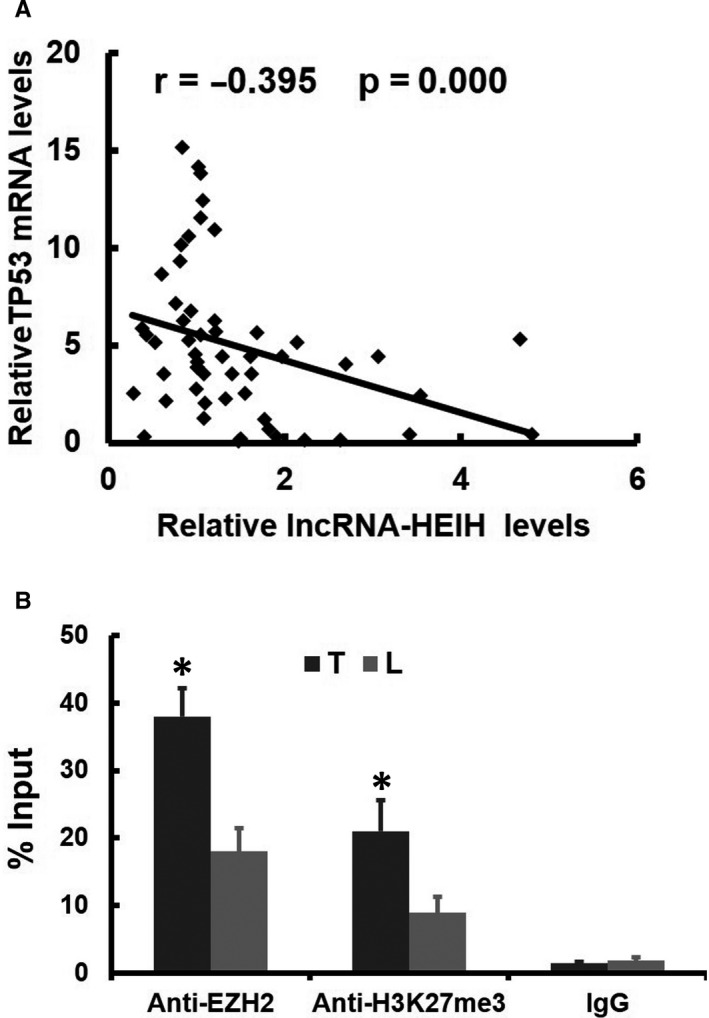
Figure 5.

Validation in Clinical Samples. (A) Expression levels of lncRNA‐HEIH and TP53 were negatively correlated in ESCC samples, as measured by real‐time PCR. The relative expression values (normalized to β‐actin) were subjected to Pearson correlation analysis. (B) ChIP analyses of ESCC and adjacent tissues (n = 12) were conducted on the lncRNA‐HEIH promoter regions using anti‐EZH2 and H3K27me3. Enrichment was determined relative to input controls. The data are the means ± standard deviations of three independent experiments
