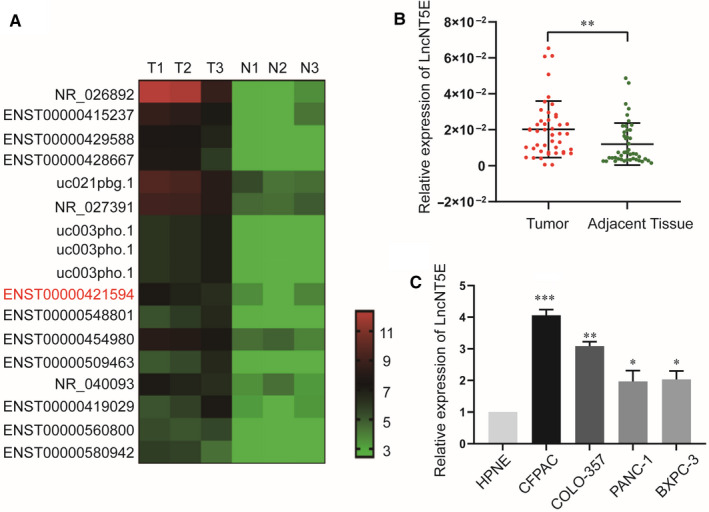
FIGURE 1.

LncNT5E is up‐regulated in pancreatic cancer (PC) tissues and cell lines. A, The heat map from our previous lncRNA microarray reflected the differentially expressed lncRNAs in PC and normal tissues. T represents PC tissue, and N represents normal pancreatic tissue. ENST00000421594 indicates lncNT5E. B, Relative expression of lncNT5E in 45 paired PC and adjacent normal tissues. LncNT5E expression from all tissues was normalized to 18S expression (ΔCT) and then compared with adjacent normal tissues and converted to the fold change (2−ΔΔCT). C, Relative expression of lncNT5E in different cell lines. Data are shown as fold change (2−ΔΔCT). *P < .05, **P < .01, ***P < .001
