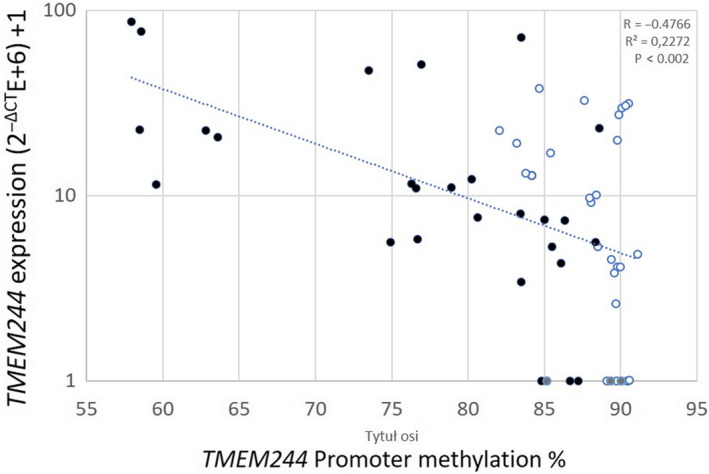
FIGURE 4.

Correlation between methylation and TMEM244 expression. Black dots: TET1 active; empty dots: TET1 inactive; grey dots: no sg

Correlation between methylation and TMEM244 expression. Black dots: TET1 active; empty dots: TET1 inactive; grey dots: no sg