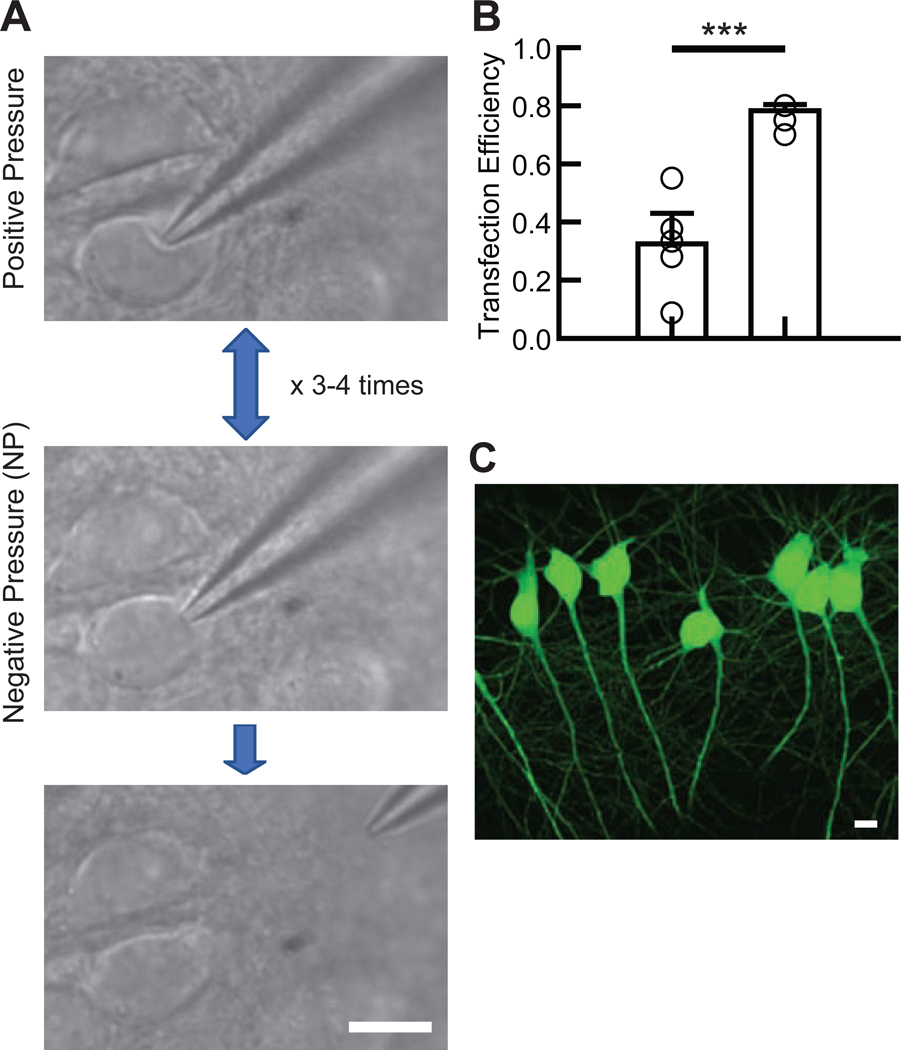
Figure 1. Electroporation procedure.
(A) The experimental flow of the electroporation procedure. Immediately after confirming the dimple on the cell body (top), mild negative pressure was applied by mouth (middle). This cycle was rapidly repeated three to four times after which electroporation was applied. Afterward, the glass electrode was gently removed from the cell body without applying pressure (bottom). (B) Summary bar graph of the transfection efficiency in CA1 pyramidal neurons using two different methods: applying electroporation either immediately after the first negative pressure (Single, left bar) or after 3–4 cycles of pressure (Pressure Cycling, right bar). Each symbol represents the transfection efficiency obtained from one organotypic slice culture (5 slice cultures from 2 mice for each condition). Student’s t-test: total number of transfected and electroporated neurons: single suction, 56 transfected neurons/ 158 electroporated neurons; pressure cycling, 112/ 143. ***p<0.001. Data shown are means ± SEM. (C) Confocal image of EGFP-transfected hippocampal CA1 pyramidal neurons.

