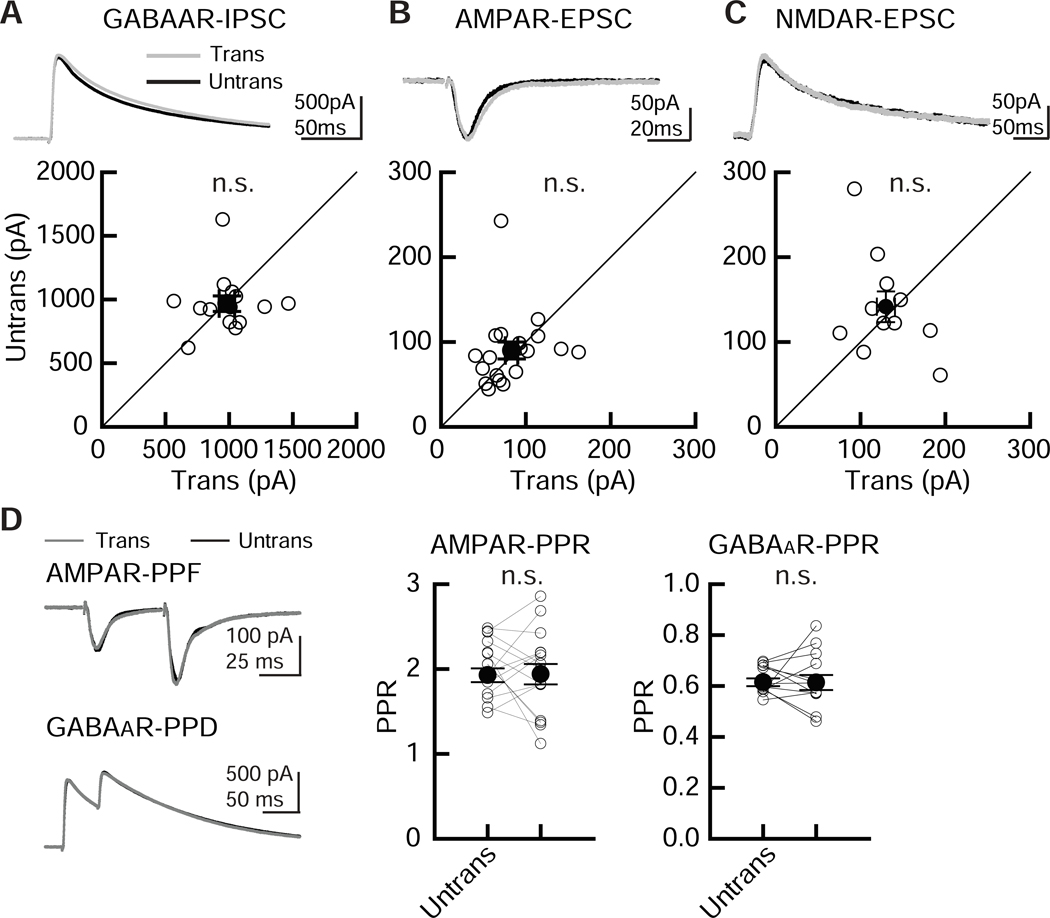
Figure 3. Comparable levels of basal synaptic transmission between EGFP-transfected and untransfected CA1 pyramidal neurons.
Electroporation of pCAG-EGFP plasmid by our modified transfection method did not alter inhibitory and excitatory synaptic transmission in hippocampal CA1 pyramidal cells. Recordings were carried out 2 – 4 days following transfection. (A-C) (Top) Sample postsynaptic current (PSC) traces mediated by GABAARs (A), AMPARs (B) and NMDARs (C) from pairs of transfected neurons (Trans, gray traces) and neighboring untransfected neurons (Untrans, black traces). Stimulus artifacts were truncated. PPF: paired-pulse facilitation, PPR: paired-pulse depression. (Bottom) Scatter plots of GABAAR-, AMPAR-, NMDAR- mediated PSC amplitude. Each pair of transfected and neighboring untransfected cells are presented as open symbols. Filled symbols indicate the mean. (D) Paired-pulse ratio (PPR) of AMPAR-EPSCs and GABAAR-IPSCs recorded from transfected and untransfected neurons, as indicated. Left, sample traces, with superimposed EPSCs and IPSCs. Middle, summary graph of AMPAR-PPR. The PPR was calculated by dividing the average amplitude of the second EPSC by that of the first EPSC. Right, summary graph of GABAAR PPR. The PPR was calculated by subtracting the averaged traces of single stimulation. Mann-Whitney U-test: number of cell pairs tested: GABAAR-IPSCs, 14 pairs/ 2 mice; AMPAR-EPSCs, 19/ 2; NMDAR-EPSCs, 11/ 2. Number of slice cultures is equal to that of pairs. n.s.: not significant. Data shown are means ± SEM.

