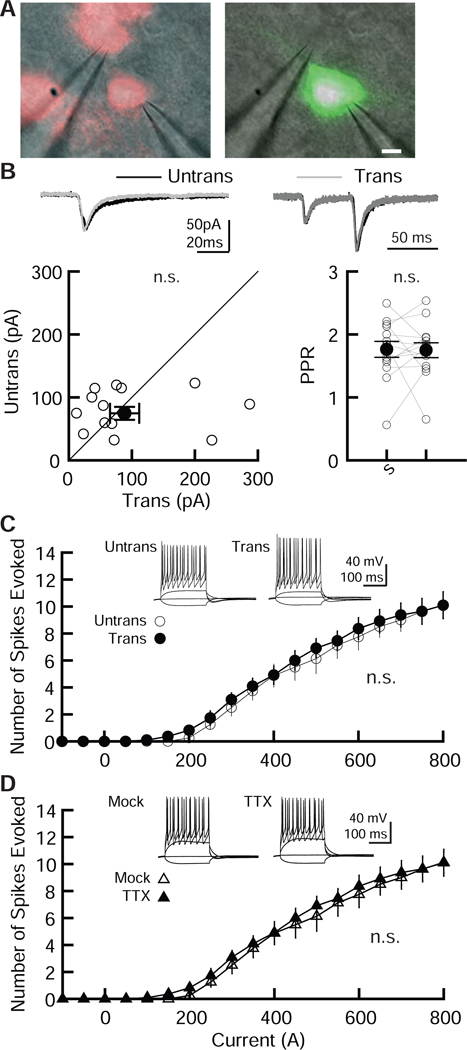
Figure 5. Comparable levels of excitatory synaptic transmission and membrane excitability in electroporated CA1 Sst-positive inhibitory interneurons.
(A) Configuration of dual whole-cell recording, superimposed TdTomato (left) or EGFP (right) fluorescent and Nomarski images, respectively. (B) (Top) Sample traces mediated by AMPARs obtained from pairs of transfected (Trans, gray traces) and neighboring untransfected Sst-expressing interneurons (Untrans, black). Stimulus artifacts were truncated. (Bottom left) Scatter plot of AMPAR-EPSC amplitude. Each pair of transfected and neighboring untransfected Sst cells are presented as open symbols. Filled symbols indicate the mean ± SEM. (Bottom right) Summary graph of AMPAR-PPR. PPR of AMPAR-EPSCs recorded from trans- and untransfected Sst neurons, as indicated. Number of cell pairs tested: AMPAR-EPSCs, 14 cells/ 2 mice. n.s.: not significant. (C, D) Effect of GFP electroporation (C) and TTX-treatment (D) on neuronal excitability in Sst neurons. (Top) Sample traces from untransfected and transfected (C), and mock- and TTX-treated (D) CA1 Sst cells. The superimposed traces were elicited by current injections of −100, 0, 200, 500 and 900 pA for 200 ms. (Bottom) Summary graph of the frequency of action potentials in GFP transfected (C) and TTX-treated (D) Sst neurons. The input–output relationship was plotted for untransfected and transfected neurons. Neurons were held at resting membrane potentials. Two-way ANOVA with post hoc Tukey: number of cells tested: untrans, 8 cells from 2 mice (8/ 2); trans, (11/ 2); mock, (10/2); TTX (10/2).

