
Fig. 3 |. Regional specificity in astrocyte-to-neuron conversion and axonal targeting.
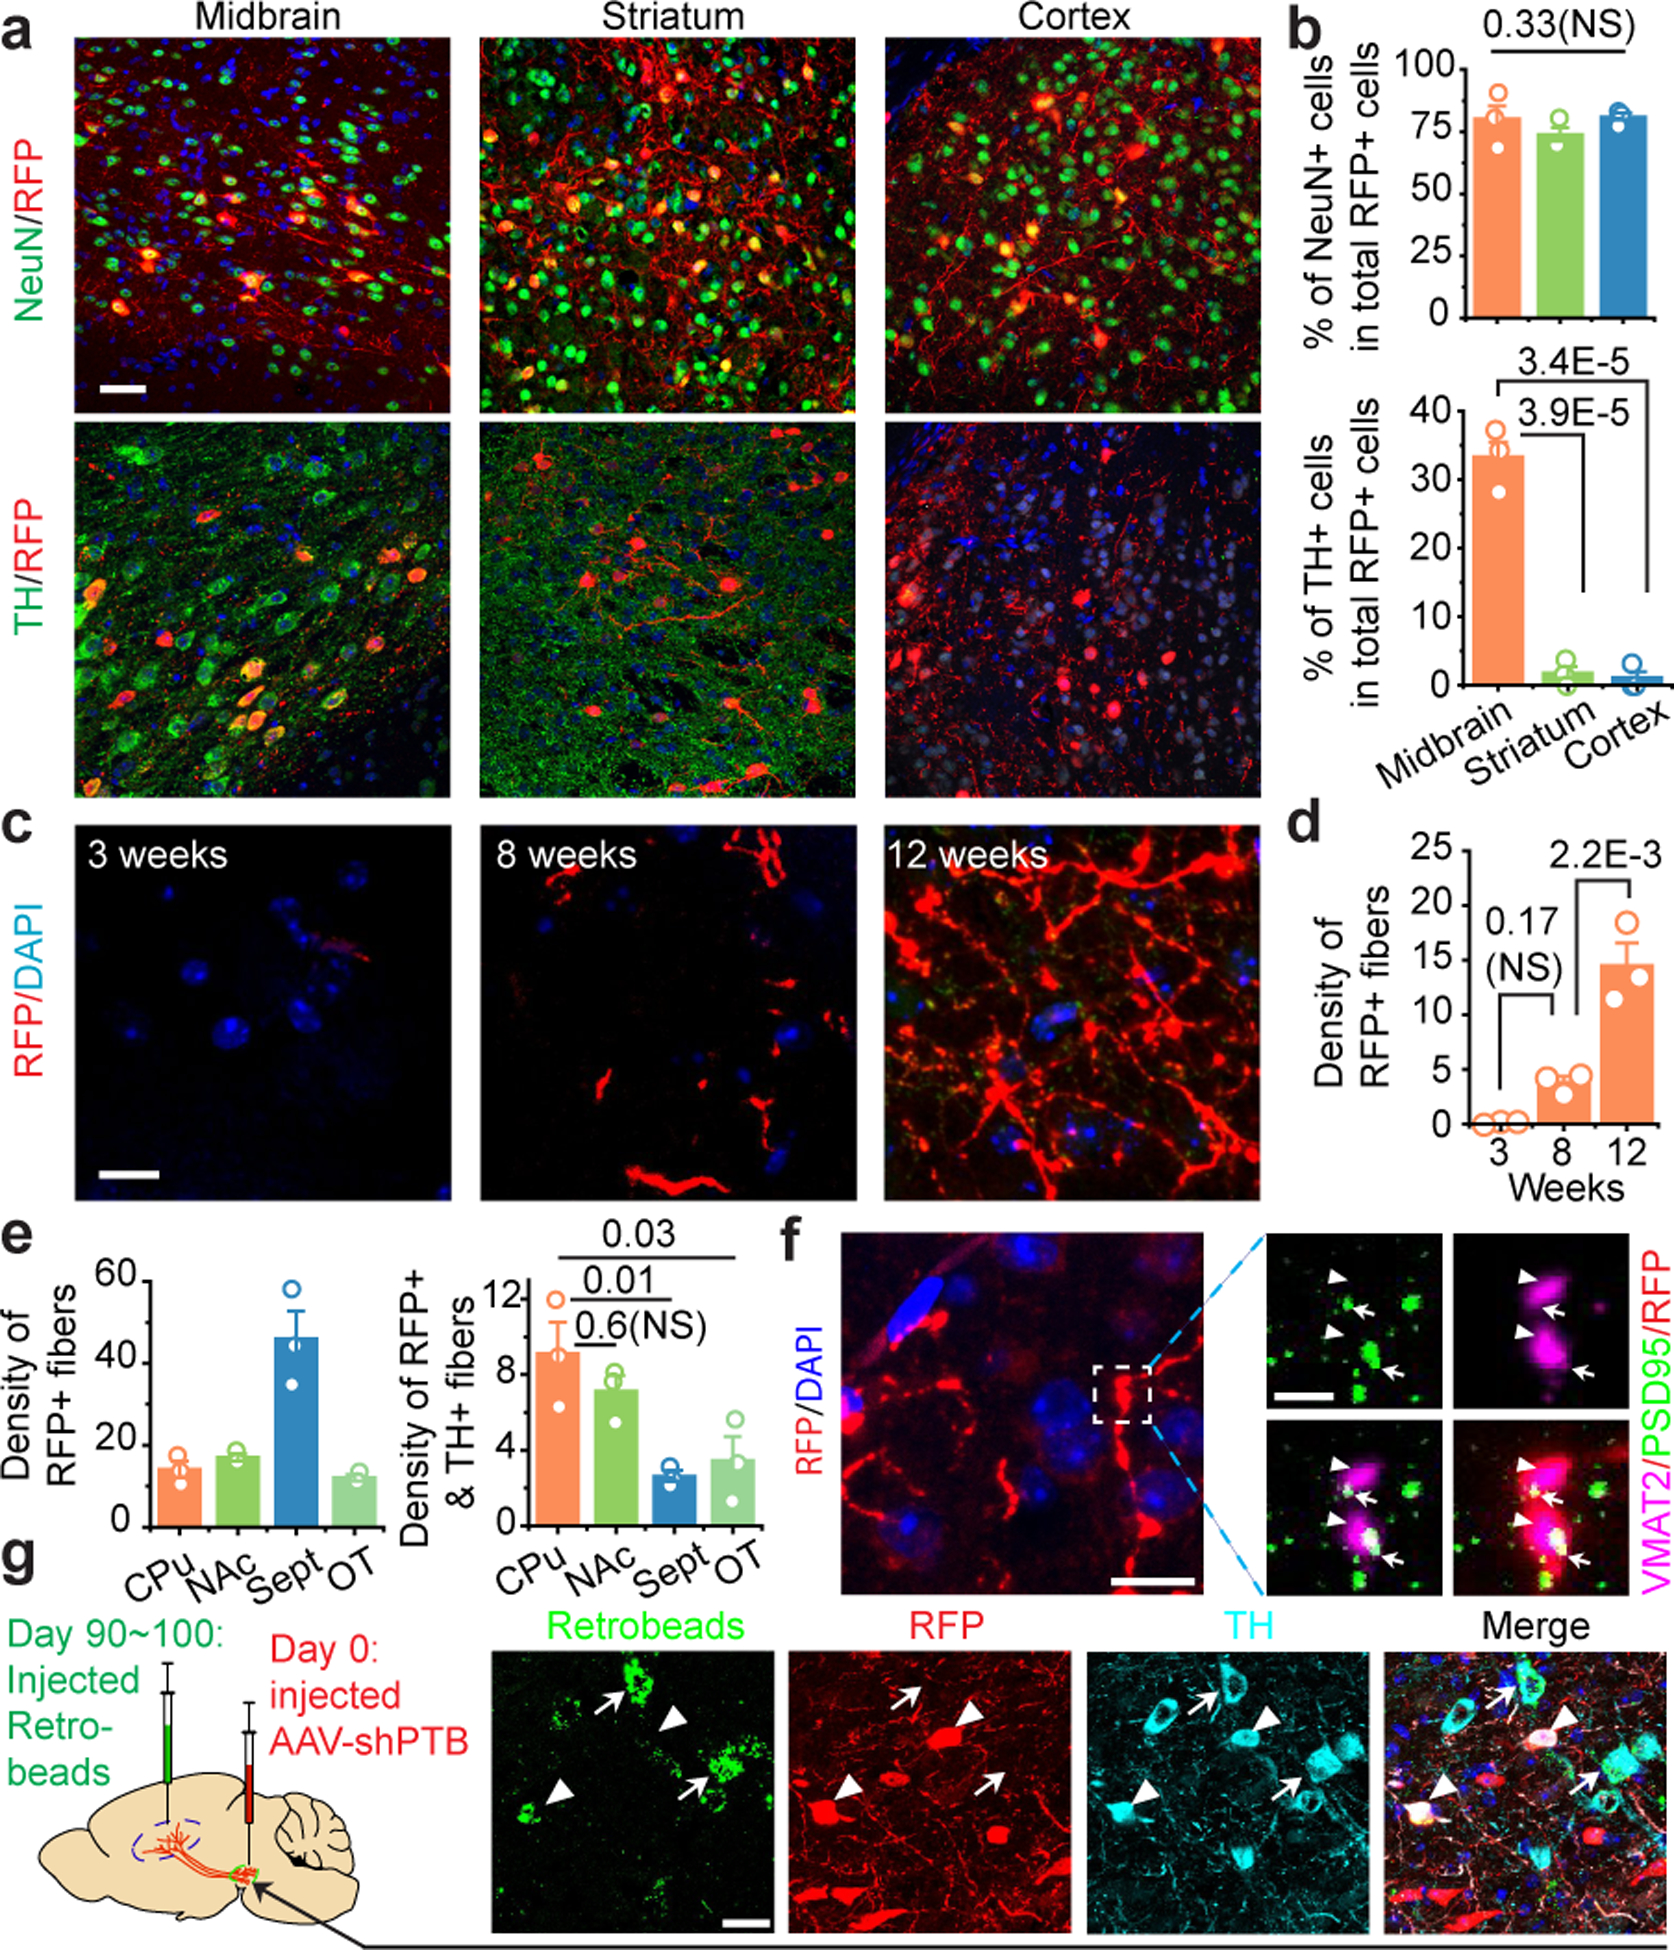
a,b, Induced NeuN+ neurons in 3 brain regions examined with TH+ neurons detected only in midbrain (a). Scale bar 30 μm. Quantified results were based on 3 mice (b).
c,d, Progressive targeting of RFP+ fibers to striatum over a course of 12 weeks (c). Scale bar: 10 μm. RFP+ fiber density was determined by the sphere method and quantified from images (n=3 biological repeats) at each time point (d).
e, Targeting of RFP+ fibers to multiple subregions around striatum, particularly Septal nuclei (left), but RFP+TH+ fibers mainly to caudate-putamen (CPu) and nucleus accumbens (NAc) (right). Quantification was performed on images collected at week 12 (n=3 mice).
f, Evidence for synaptic connection in caudate-putamen, as indicated by colocalization in the amplified window between the presynaptic marker VMAT2 (arrowheads) and the postsynaptic marker PSD95 (arrows) on RFP+ fibers. Scale bar: 10 μm; enlarged window: 2 μm.
g, Labeling of RFP+TH+ cells in substantia nigra with retrograde beads injected into striatum 90 to 100 days after reprogramming (left). Arrowheads: beads-labeled converted cells; arrows: beads-labeled endogenous (TH+ RFP-) DA neurons. Scale bar: 20 μm.
Statistical significance in (b), (d), (e) was determined by ANOVA with post-hoc Tukey test and represented as mean+/−SEM. NS: not significant. Specific P-values are indicated in each panel. (f), (g) was each based on 3 independently repeated experiments with similar results.