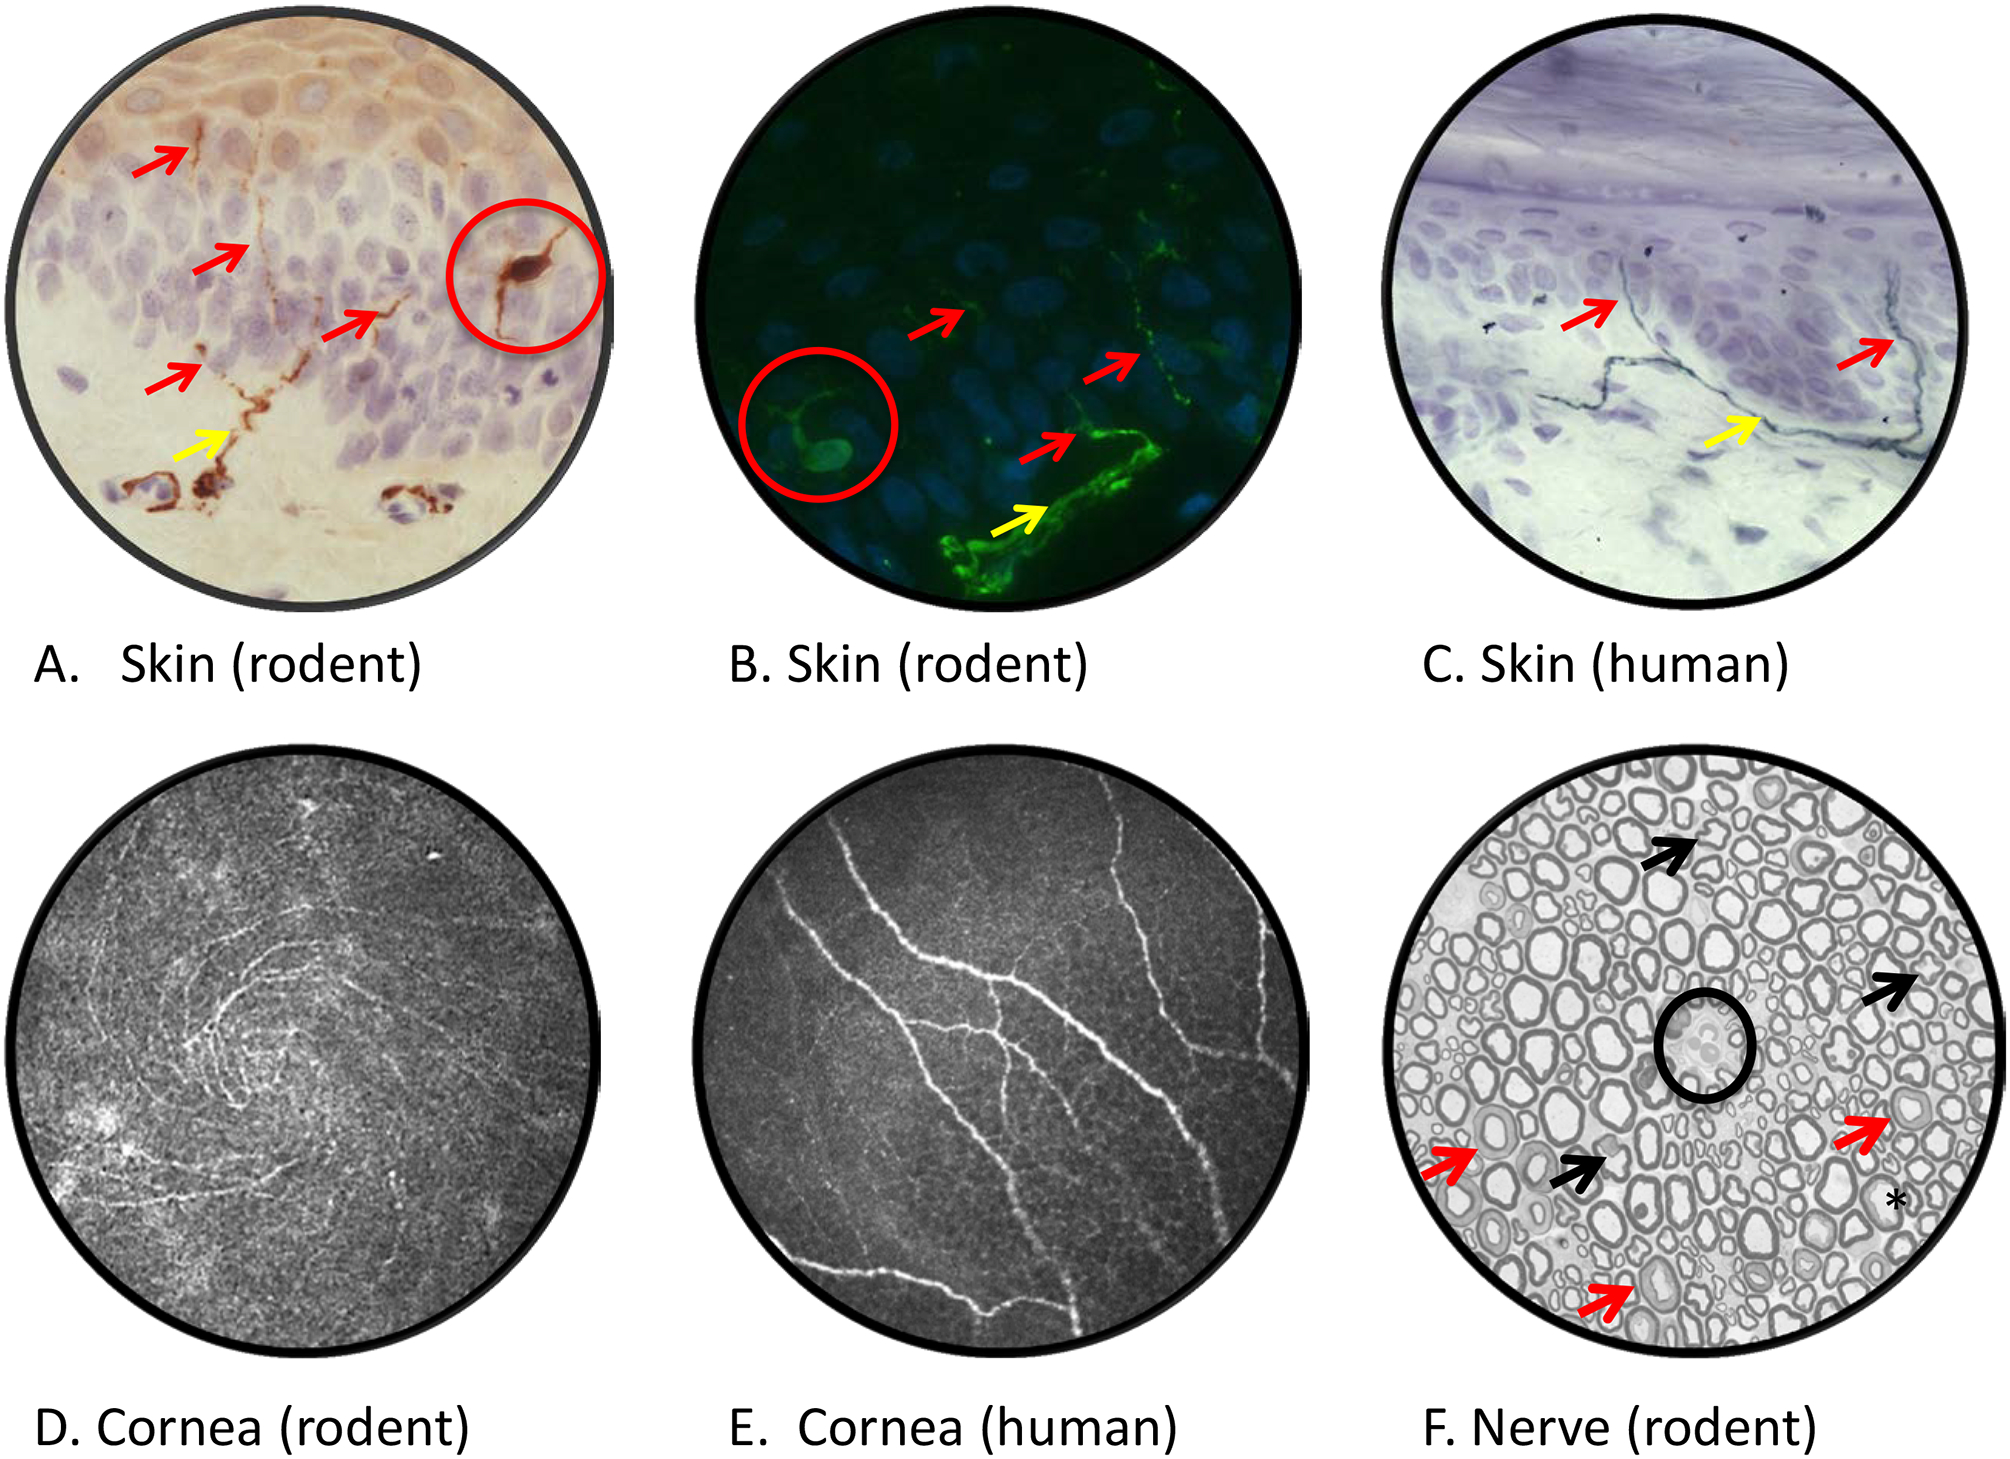
Figure 2: Imaging diabetic neuropathy.

Rat plantar skin stained with antibody to PGP9.5 and viewed by bright field (panel A) or fluorescence (panel B) microscopy reveals dermal nerves (yellow arrows) projecting across the dermal:epidermal junction and into the epidermis (purple/blue counterstained nuclei) where they form profiles of intra-epidermal nerve fibers (red arrows). Note that PGP9.5 also stains epidermal Langerhans cells (red circles). Diabetic rodents and humans (panel C) show early reductions in IENF density that are associated with both sensory loss and pain [23, 276]. Confocal images of the corneal sub-basal nerve plexus of a live mouse (panel D, showing inferior whorl) and human (panel E]. Reduced corneal nerve morphometric parameters are detected within weeks of onset of diabetes in rodents [52] and in early stages of clinical diabetic neuropathy [276]. A cross section of sciatic nerve from a STZ-diabetic rat (panel F), with an endoneurial blood vessel at the centre of field (black circle), lacks overt evidence of the axonal degeneration or demyelination common in nerve biopsies from diabetic patients. Apparently mis-shapen axons (black arrows) represent normal paranodal regions of the nerve fiber while multiple myelin profiles illustrate normal Schmidt-Lanterman incisures (red arrows). Mild axonal fixation artifact is illustrated by the black star. Morphometric analysis identifies reduced mean axonal diameter in the absence of significant fiber loss, indicative of axonal atrophy or impaired maturation. Technical details of procedures used to generate these images and representative data showing the effects of diabetes are published [168]. Images by Ms. Katie Frizzi, Ms. Lucie Guernsey and Ms. Alex Marquez.
