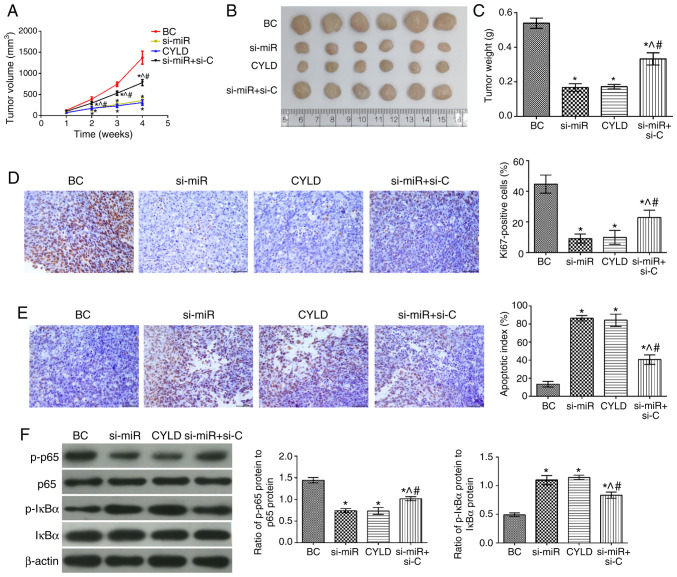
Figure 6.
Effect of miR-181b targeting CYLD on SW480 cell xenografts. (A) Tumor volume. (B) Tumor image. (C) Tumor weight. (D) Immunohistochemistry results showing Ki67 expression in the transplanted tumors (magnification, ×400). (E) TUNEL assay results showing tumor cell apoptosis (magnification, ×400). (F) Results of western blot analysis showing the expression levels of the NF-κB signaling pathway-related proteins in tumor tissues. *P<0.05, compared with the BC group; ^P<0.05, compared with the si-miR group; #P<0.05, compared with the CYLD group. BC, blank control; NC3, CYLD overexpression negative control; NC4, CYLD silencing negative control.

