Figure 5.
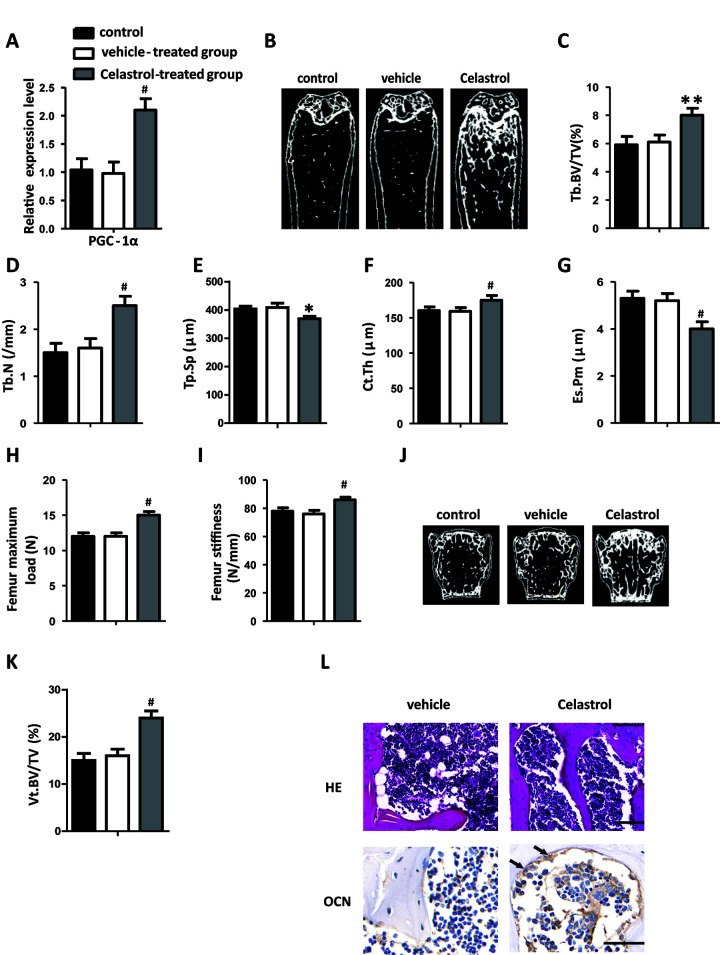
Celastrol treatment increased bone formation and reduced bone marrow fat in OVX mice. (A) mRNA expression level of PGC-1α in the BM-MSCs determined using qRT-PCR (n = 3 per group). (B–G) Representative μCT images (B) and quantitative μCT analysis of trabecular (C–E) and cortical (F, G) bone microarchitecture of the femora of Celastrol-treated mice. n = 6-7 per group. (H–I) Three-point bending measurement of femur maximum load (H) and stiffness (I). n = 5 per group. (J, K) Representative μCT images (J) and quantification of the ratio of bone volume to tissue volume (K) of L4 vertebrae (Vt. BV/TV). n = 6 per group. (L) Representative images of H&E staining (L, top) and osteocalcin immunohistochemical staining (L, bottom). Scale bars: 100 μm. n = 5 per group. Data are presented as mean ± SD. Statistical significance was determined using analysis of variance (one-way ANOVA). #P < 0.001; **P < 0.01, *P < 0.05.

