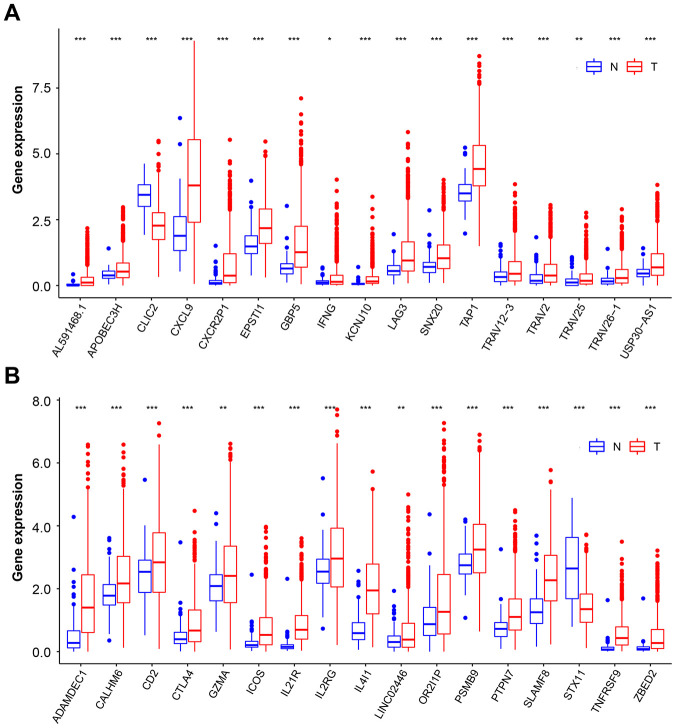
Figure 3.
Overlapping genes expression on BC and normal tissue samples. (A and B) Box plot representation of 34 overlapping hub genes expression on normal tissue (blue box) and BC (red box) samples. The median, first quartile, and third quartile of expression on distribution are shown. BC, breast cancer. * p < 0.05, ** p < 0.01, *** p < 0.001.

