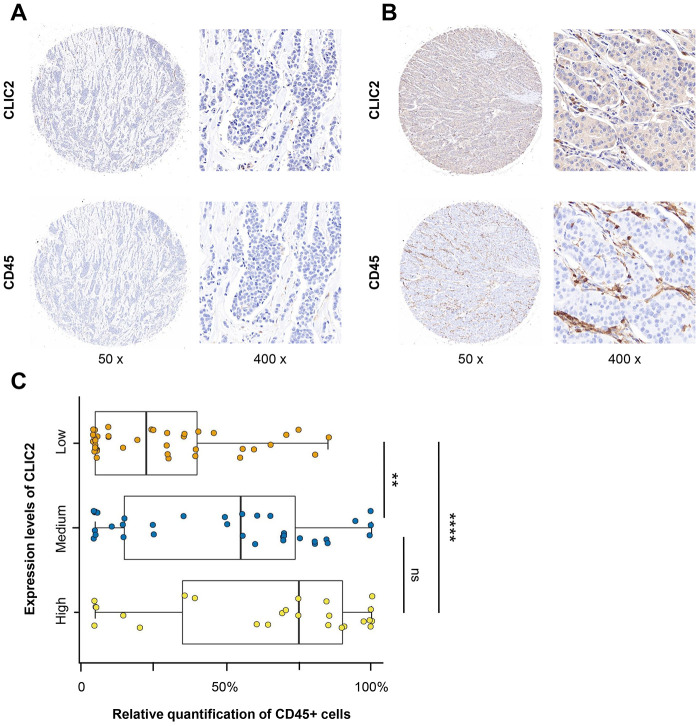
Figure 8.
IHC analysis found that CD45+ cells were abundant in CLIC2 highly expressed tissue. (A) Low CLIC2 expression and low percentage of CD45+ cells. (B) High CLIC2 expression and high percentage of CD45+ cells. (C) Boxplot with scatter shows the different CD45+ cells percentage in tissue with different expression levels of CLIC2. ** p < 0.01, **** p < 0.0001.

